1 Introduction to Part 1 GIS ideas and concepts
1.0.1 Learning Objectives:
- Gain a basic understanding of what a GIS is and its relevance to transport studies
- Know what some of the key data types and file formats
- Import pre-cleaned vector data into QGIS and navigate basic QGIS features
- Select a subset of the data
- Make a map showing point, line and polygon features and export it.
- Understand the key cartographic elements that must be present to allow interpretation of a map
1.0.2 What is included in Part 1?
- GIS ideas and concepts - we very briefly introduce some key GIS concepts and ideas.
- Opening QGIS and key features - We then explain what the main components of QGIS are, explain how to set up a project and save work and what some of the most useful buttons do
- Downloading and loading data - we show you how to get some data we have prepared for the workshop and load it into QGIS
- Style and select features - change the way features look on the screen
- Making maps - Make a map which you can export and include in a document
1.1 What is GIS?
1.2 Key ideas:
GIS is an abbreviation. Sometimes it is used to mean Geographic Information System and sometimes it is used to mean Geographic information Science. A more formal definition of a Geographical Information System is:
A powerful set of tools for collecting, storing, retrieving at will, transforming and >displaying spatial data from the real world (Burrough, 1986)
The emphasis here is on pieces of software like QGIS. In practical terms a Geographic Information System is a database to store data, a calculator which can manipulate and analyse data, a visualisation window to show results. GIS software like QGIS also has a Graphical User Interface (GUI) with menus and buttons which lets the user ‘do stuff’.
In Part 1 we are concentrating on learning how to use the basic features of the Geographic information System application called QGIS
A more formal definition of Geographical Information Science is given by
Goodchild, (1992) who argues that Geographical Information Science involves research that investigates spatial data acquisition, spatial statistics, modelling and theories of spatial data, development of analytical tools and consideration of the management and ethics of working with spatial data.
As an introduction the wikipedia entry cotrains alot of information. In the further reading section there are references to key GIS textbooks for a more formal treatment of key GIS concepts.
https://en.wikipedia.org/wiki/Geographic_information_science
GIS in both of the systems and science contexts described above is important for anyone studying transport because it is an inherently spatial topic of study. Data used in the study of transport can be visualised and analysed using GIS. Learning how to use a GISystem like QGIS is a very useful skill in its own right. It is also a very useful start point for people wanting to learn and apply GIScience.
There are other terms you may come across including “spatial data analytics”. The emphasis here is on a branch of science at the nexus of statistics, computer science and quantitative geography. You may also come across the term “geo-computation”. Geocomputation is associated with computational methods that has been customized to address the special characteristics of spatial data ( https://dx.doi.org/10.4135/9780857024442.d64). There are technical academic differences between these terms, but in practice they get used interchangably. This range of terms might sound confusing, but they are all related.
1.3 Free and Open Source Software.
We are using QGIS software which is free to download and use. The university has a licence for commercial GIS software, but we are aware that not all students will have access to commercial software after completing the course. QGIS is becoming popular with many organisations. For more information about FOSS see: https://en.wikipedia.org/wiki/Free_and_open-source_software
1.3.1 Vector data
Vector data represents the features of the world as either ‘points’ ‘lines’ or ‘areas’ (also called polygons).
Each type of feature is displayed in the GIS as a distinct layer. A layer will only contain either points, or lines or polygons. It is also good practice to have different layers for different types of line features. For example it is good to have a layer for roads and another for rivers.
Maps can be made of several layers of vector data as seen here:
https://upload.wikimedia.org/wikipedia/commons/3/3b/USGS_The_National_Map.jpg
1.3.2 Raster data:
‘In its simplest form, a raster consists of a matrix of cells (or pixels) organized into rows and columns (or a grid) where each cell contains a value representing information, such as temperature. Rasters are digital aerial photographs, imagery from satellites, digital pictures, or even scanned maps’. ( webhelp.esri.com/arcgisdesktop/9.2/index.cfm?TopicName=What_is_raster_data%3F)
(source: http://support.esri.com/other-resources/gis-dictionary/term/raster)
1.3.3 Network data
A network dataset takes a line dataset and defines its topology explicitly. Defining topology means having a data tables that explicitly lists which lines are connected and at which nodes.
In its simplest form this means that the connections between the ends of different lines are recorded in the GIS.
1.3.4 Data formats – how is data stored in a GIS and on your computer.
QGIS can handle a very large number of different data formats.
In today’s exervises we will start by using use a file format called “Shapefile” as it is a very common type of vector GIS data format. The Shapefile format was developed by ESRI who make the commercial GIS software ArcGIS(ArcGIS is also available on university machine).
The Shapefile format appears on your computer as several files which may seem a little confusing. Each file contains a different type of information that the GIS needs to represent the spatial data.
NB. If you ever want to share a shapefile with someone, you have to send the whole group of files
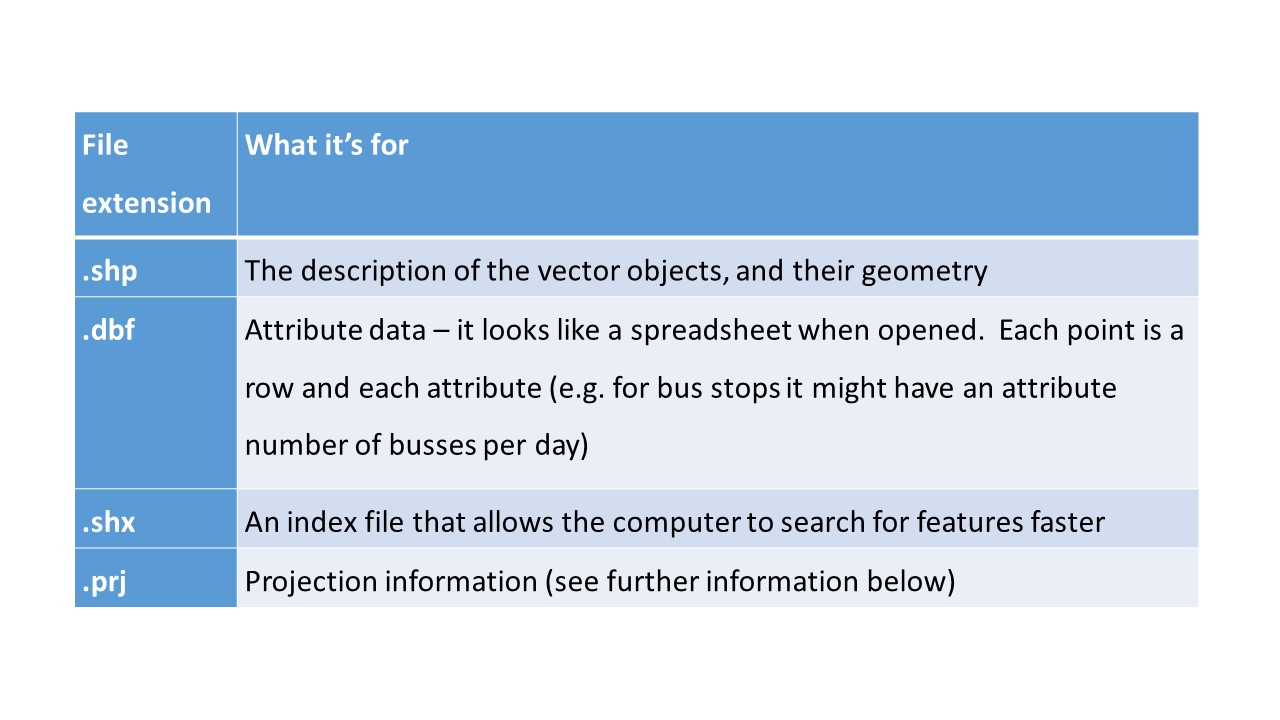
Figure 1.1: A shapefile is a group of files. It is a common file format
There are other types of GIS files including as JSON and geo-package formats. Data is stored in GIS as database tables.
GIS data can be stored and shared in a very large number of ways. (For an introduction see https://en.wikipedia.org/wiki/GIS_file_formats as well as the further reading in the appendix.
1.4 Projections and co-ordinate systems
The world is not flat but computer screens are. Projections and co-ordinate systems allow GIS to represent the curved surface of the earth on a flat screen or page.
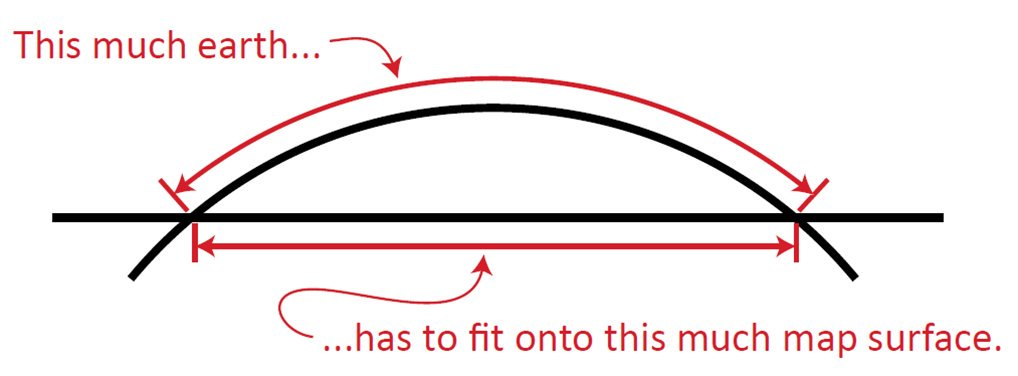
Figure 1.2: How do we fit a curving earth onto a flat piece of paper
Image source comes from this presentation: http://mjfoster83.github.io/projections/#/5
The projection is a mathematical formula explaining how places in the real world which are on a near spherical globe can be represented on a flat map. More information on projections and coordinate systems can be found in GIS test books.
Coordinate Reference Systems (CRS) refer to different ways of defining the X and Y coordinates used in different projections. Largely they fall into two categories:
Geographical Coordinate Systems: use latitude and longitude to represent any place on the Earth
Projected Coordinate Systems: use distances from an origin point to represent a small part of the Earth, e.g. a country. The advantage of a projects CRS is that it is easier to calculate properties such as distance and area as coordinates are in metres.
You can find a catalogue of different CRSs at http://spatialreference.org/
CRSs are often referred to by the EPSG number. The European Petroleum Survey Group publish a database of different coordinate systems. Two useful projections to commit to memory are:
- 4326 - the World Geodetic System 1984 which is a widely used geographical coordinate system, used in GPS datasets and the .geojson file format, for example.
- 27700 - the British National Grid