6 Making maps
6.1 Creating a print layout
While it is useful to view maps within QGIS it is usually necessary to export the maps for printing or to be included in a report.
From the project menu select “New Print Layout”, you will be asked to give your new layout a name. You will then see a blank page.
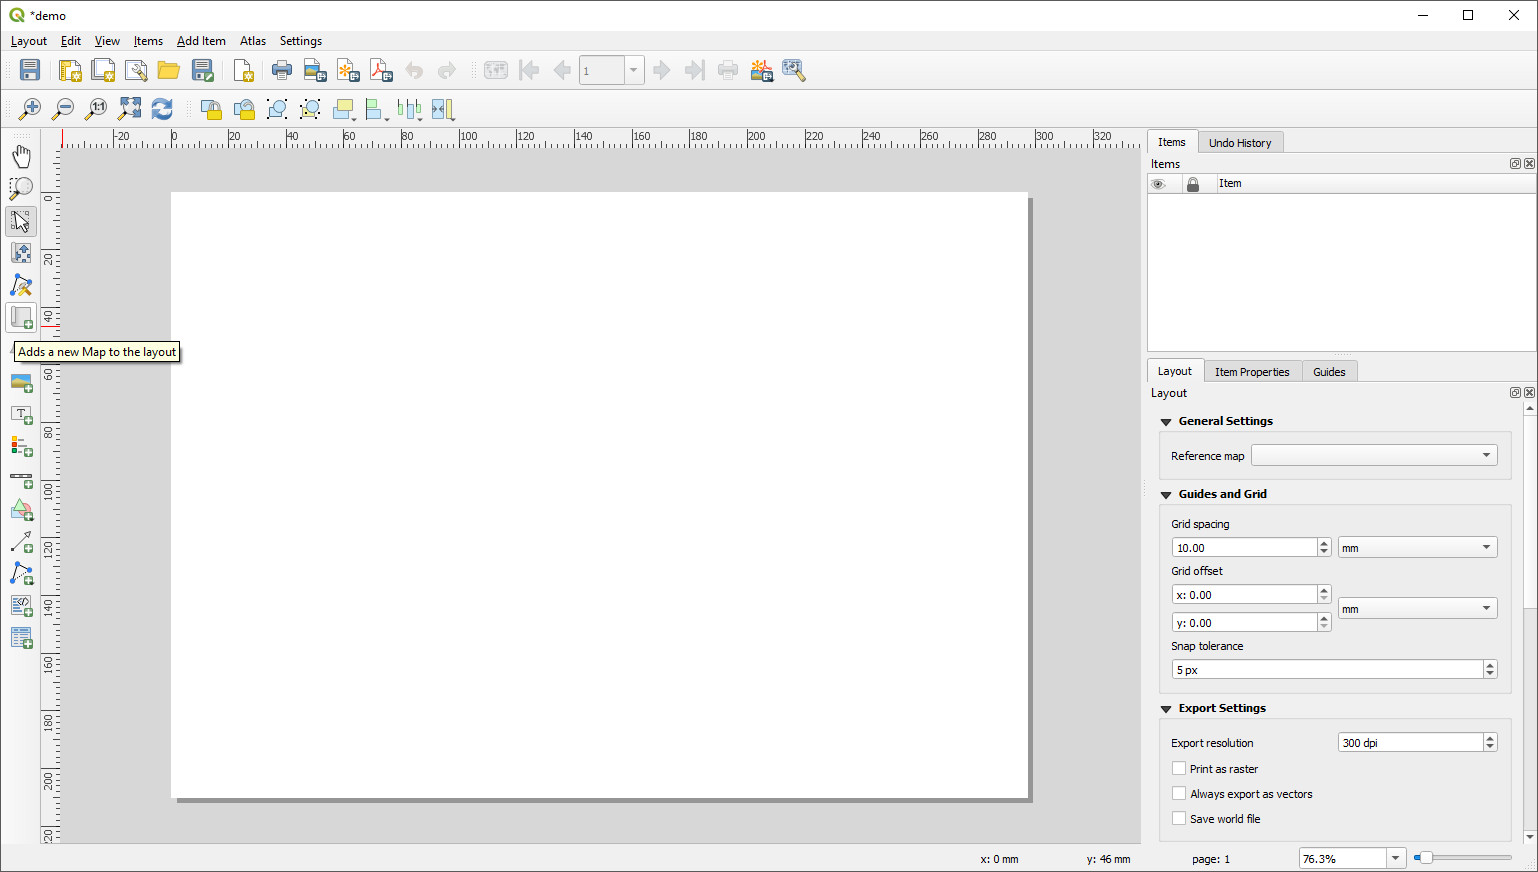
Figure 6.1: The print layout window, highlighting the add new map button
Use the “Add new map button” to draw a box where you wish your map to be on the page. Your map will appear within the box automatically.
You can pan and zoom within the map using the “Move Item Content” button

Figure 6.2: Move Item content button
To the right of the print layout you will see a panel. In this you can set the properties of the different elements on your map. For example you can change the scale of your map.
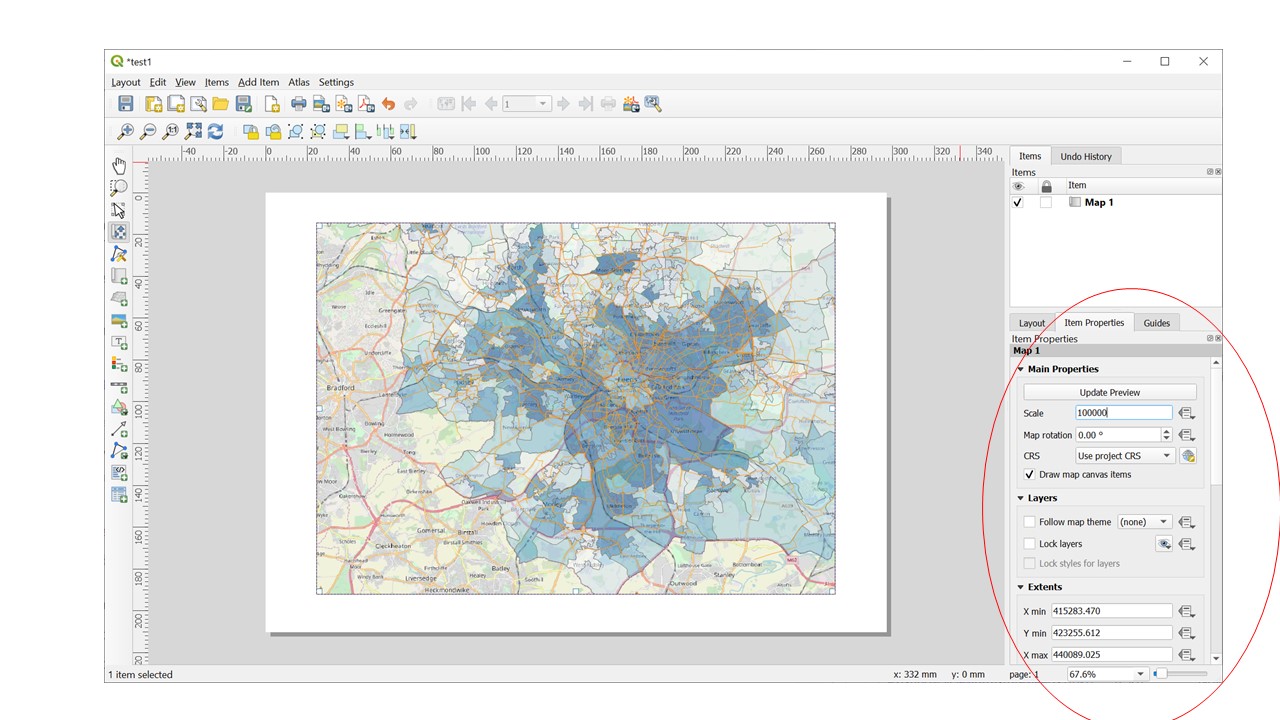
Figure 6.3: Setting the scale of the map in the print layout
6.2 Basic but essential cartographic elements that allow interpretation of your map.
The QGIS print composer lets you set many aspects of how each feature looks on the page.This takes practice, but it is possible to produce very striking maps which convey important information. Communicating the insights drawn from spatial data to policy stakeholders is an important aspect of transport research and planning so it is worth the effort.
Add a map title
Every map needs either a title or a caption to explain to the reader what is being shown.
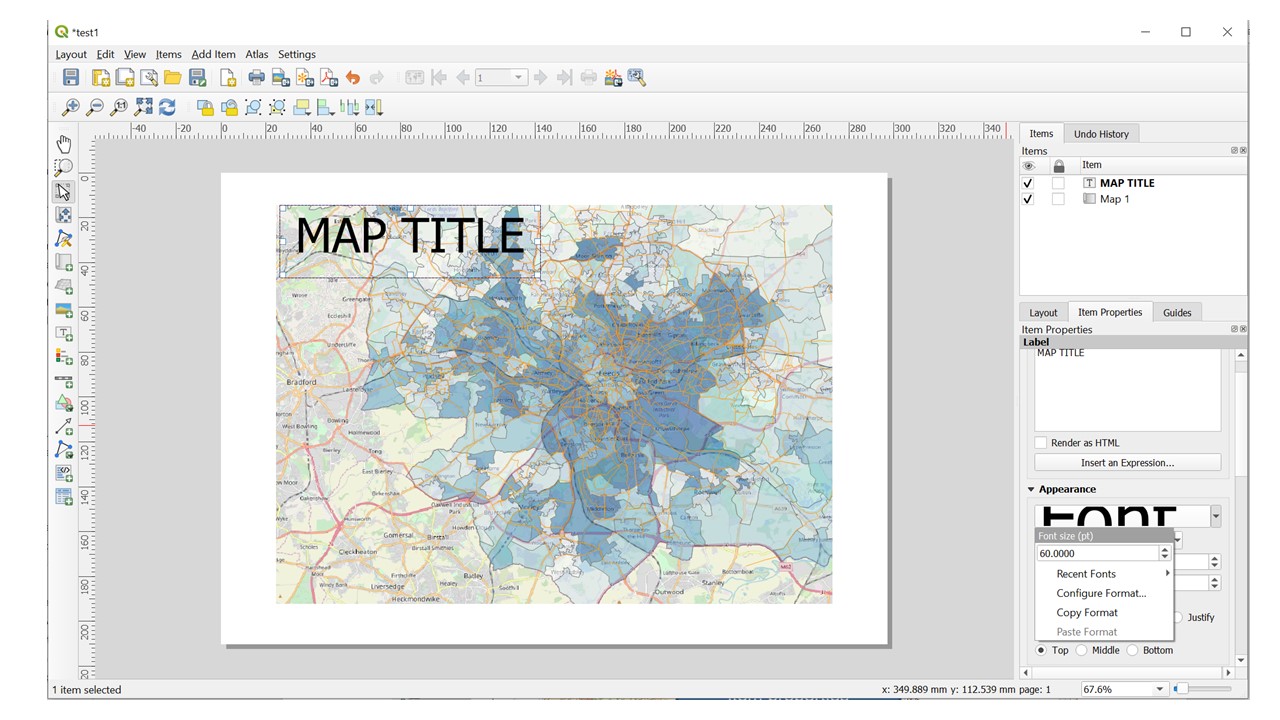
Figure 6.4: Add a Map title in the print layout
Add a title. Press the ‘add new label’ button on the left of the print layout. If you run the mouse ofer the buttons their names will be displayed on the screen.
Click on the page, above the map, and a label will appear at the top of the map.
Resize it and place it in the top centre of the page. It can be resized and moved in the same way that you resized and moved the map. As you move the title, you’ll notice that guidelines appear to help you position the title in the centre of the page.
However, there is also a tool to help position the title relative to the map (not the page):
- Click the map to select it.
- Hold down ‘shift’ on your keyboard and click on the label so that both the map and the label are selected.
- Look for the Align button on the tool bar near the top of the print layout.

Figure 6.5: The Align button
Add a scale bar
Press the scale bar button on the left of the print layout.
Insert a scale bar using the scale bar button shown below and changing the settings using the settings in the scale item properties.
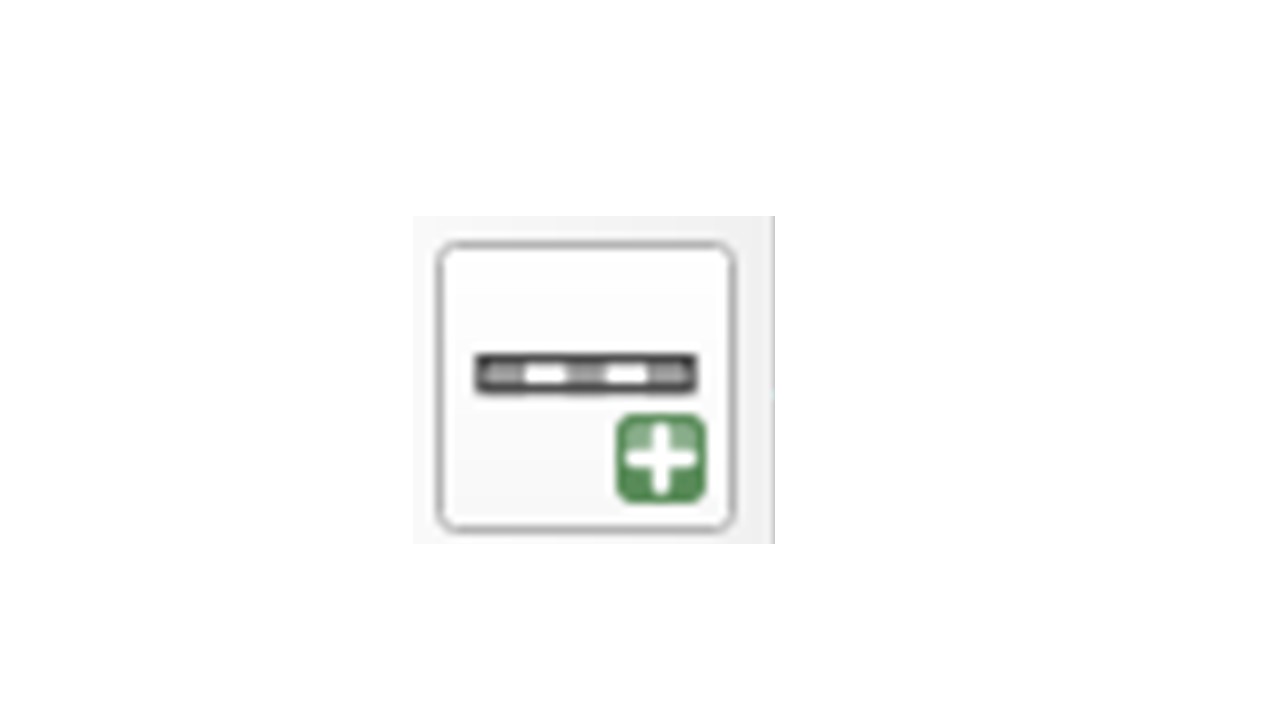
(#fig:scale_bar_button)The scale bar button
- On the right of the screen click the item properties tab.
You can change the map units to metres or miles if you with by pressing the dropdown menu in the Units area. You can change the look of the scale bar by changing the number of segments. You can also click the triangle next to fonts and colours to further change the appearance of the scale bar.
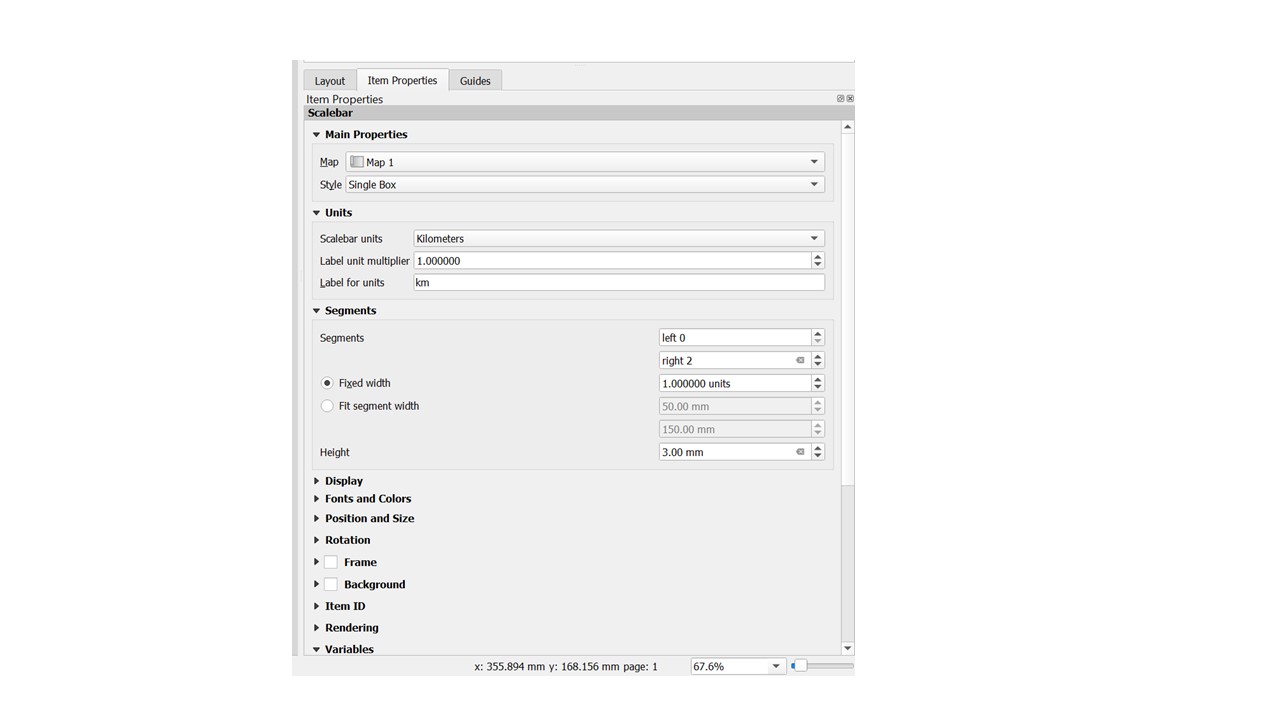
Figure 6.6: The Align button
Add a legend The map reader also needs to be able to see what various things on the map actually mean. In some cases, like the place names, this is quite obvious. In other cases, it’s more difficult to guess. Let’s add a new legend.
- Click on the legend button
- Click on the page to place the legend, and move it to where you want it:
- It may initially have more entries than you want. Go to the legend box on the right of the screen, un-check the auto update box.
- Click on ‘OpenStreetMap’ if you have a basemap, and then press the red minus button below the list. Repeat this for any other layers that you don’t want in the legend.
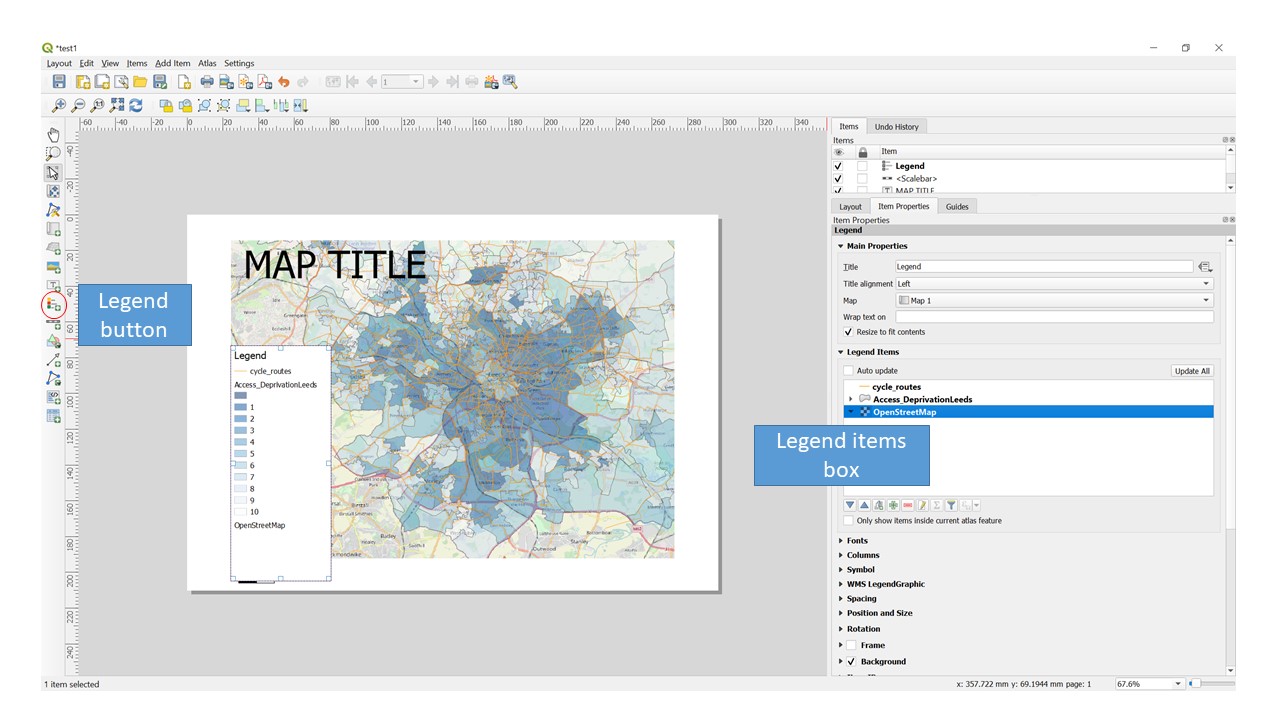
Figure 6.7: Add a map legend. Use the legend button and the legend items box
6.3 Saving & Exporting your map
You can save a map layout for later use using the save button on the main toolbar or using “Save project” in the “layout” menu. You can export your image in one of three formats.
- Export as Image - A range of different formats including JPEG, PNG, GIF, TIF etc
- Export as PDF - A PDF document
- Export as SVG - A Scalable Vector Graphics image
All of these options and the option to print your map directly are in the “layout” menu.
6.4 Summary
This chapter has briefly introduced the print layout window.
Before moving onto the next chapter make sure you have.
- Produced your own print layout including a map, title, scale bar, and legend.
Bonus Exercises
Experiment using different tools in the print layout window. Can you find out how to:
- Pan and zoom the map to a specific area of interest
- Customise the title font and appearance
- Add an arrow pointing to your location
- Add the ITS logo to your print layout