3 Downloading and loading data
3.1 Downloading data
A vital skill for doing using GIS skills to solve real-world problems is finding, downloading and importing data.
Often, the first stage in the data downloading/loading process is to find the data online.
You will need several data sets to add to your QGIS project. First you will need to download the data.
Click on the link below or type in the following URL into your internet browser:
github.com/ITSLeeds/QGIS-into/releases.
On that page you will see several links. For the exercises in part 1 you will need this one: qgisdata.zip. Download and unzip the files into an appropriate place on your computer, in the folder where your QGIS project lives.
Once downloaded, right click on the zipped folder that has been downloaded to your computer and select “extract all”.
3.2 Importing spatial data
To load a spatial data file, click on the Data Source Manager button in the top left corner of QGIS (see Figure 3.1).

Figure 3.1: The Data Source Manager icon
We will first load a polygon layer.
- Open the Data Source Manager and select “Vector”.
- Next press the button with 3 dots, which is below and right of where it says source.
- Next navigate to the file by finding the folder “qgisdata”.
- Inside this is another folder “Access_DeprivationLeeds”
- Add the data: “Access_DeprivationLeeds.shp”
- Click “Add” then “Close”. Note the data manager does not close automatically after adding a file to your project, this is to allow you to add multiple files at once.
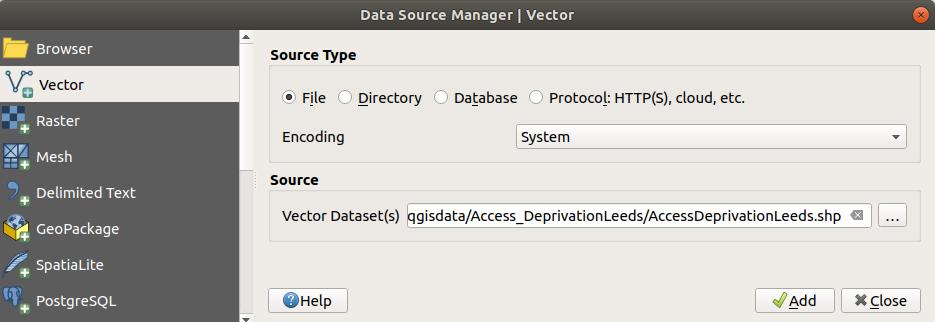
Figure 3.2: The Data Source Manager - Vector
The result should look something like the map displayed in Figure 3.3 (but the colour might be different).
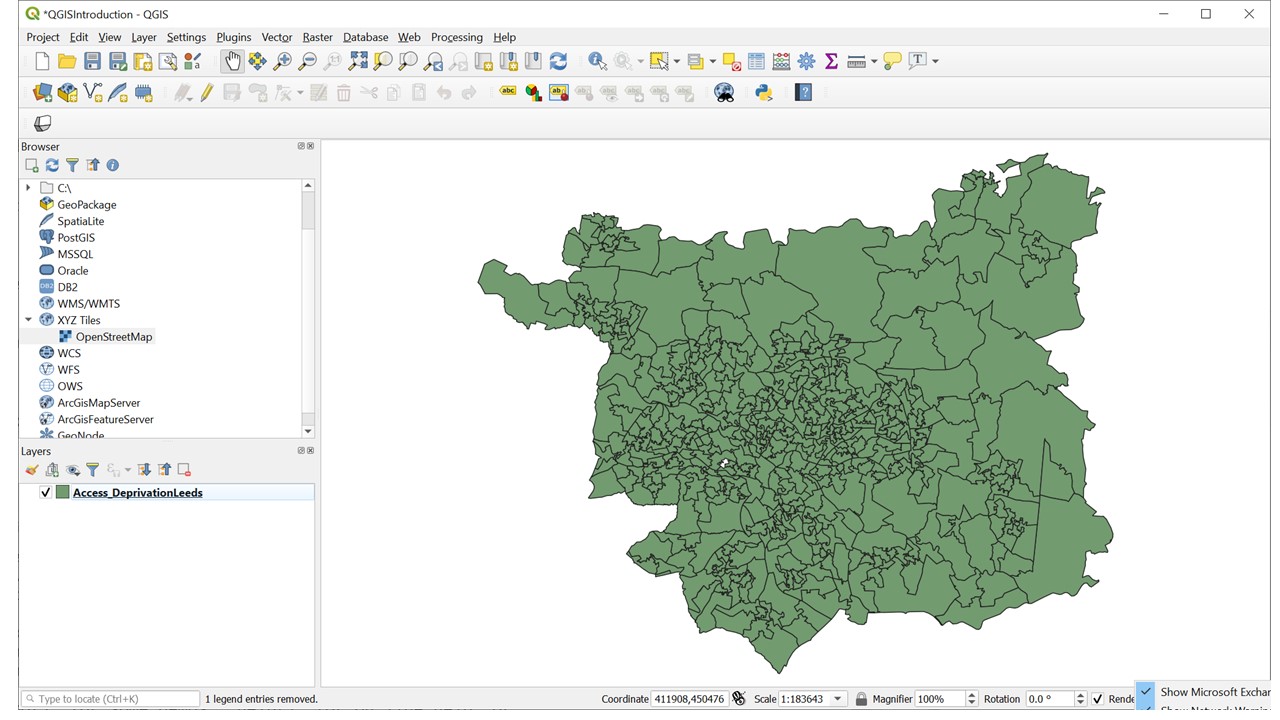
Figure 3.3: The map after the file ‘Access_DeprivationLeeds.shp’ has been imported.
Next add the cycle_routes layer (note this is a line layer).
Follow the steps above, but note that you may need to ‘navigate up the file tree’ (which means go up a folder level to ‘IntroQGISdata2019’) then you will be able to click on the folder ‘cycle_routes’.
3.3 Importing a CSV or text file
3.3.1 CSV with spatial data
We have already loaded polygon and line data. Now we will add point data Sometimes you have data that contains spatial information but is not in a spatial data format. A common example is to have a CSV file with latitude and longitude columns. CSV is a common format for storing data and can be opened by lots of different software, including Microsoft Excel. We will plot the location of vehicles collisions in Leeds. Use the ‘stats19.csv’ example file.
- Open the Data Source Manager and select “Delimited Text” then specify the “File Name” and location, or use the … to navigate to the file.
Under the “Geometry definition” select “Point coordinates” and set the “X field” to “longitude” and the “Y field” to “latitude”. Set the “Geometry CRS” to “EPSG: 4326 – WGS 84”. Note here we are explicitly telling QGIS the CRS of the data.
Click “Add” then “Close”.
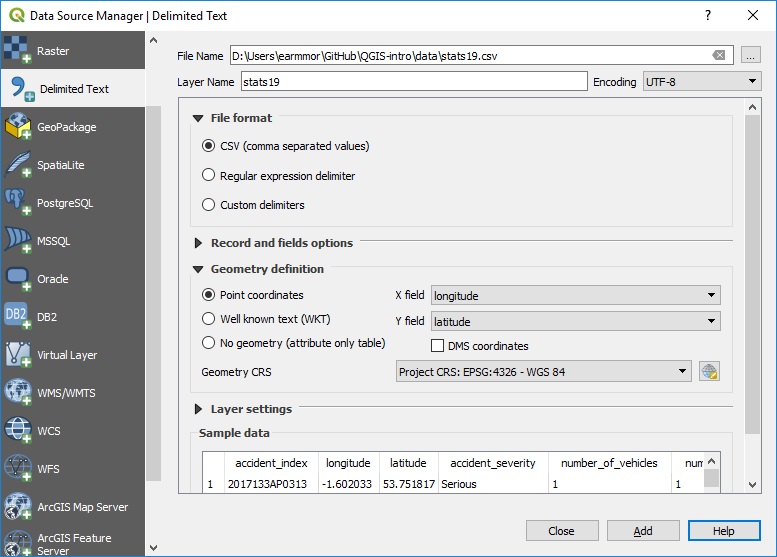
Figure 3.4: The Data Source Manager - Delimited Text
After importing the ‘stats19’ data, using menus shown in Figure 3.4, you should see points on the map, representing where crashes in Leeds took place in 2017. If you do not see dots on the map, re-read this section and have another go. If you do, like in Figure 3.5, congratuations, you can now load data into QGIS!
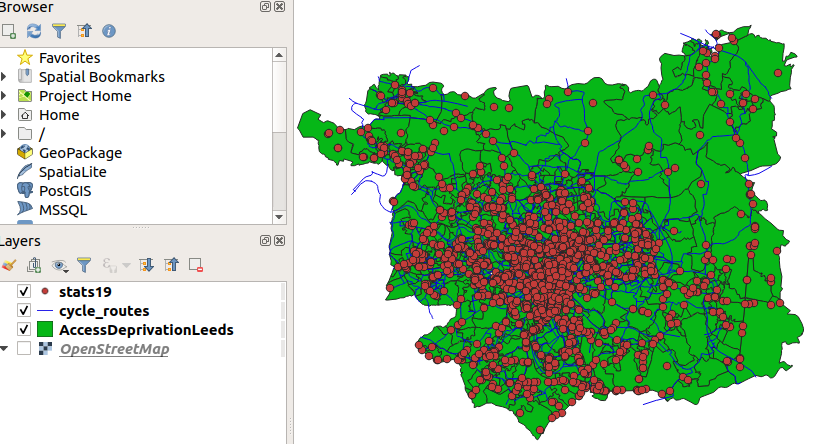
Figure 3.5: Summary of the data loaded in this Chapter, note the name of the datasets in the Layers menu.
3.4 Loading basemaps
You can add a “basemap” as follows:
- Click on the ‘XYZ Tiles’ option in the Browser Panel. Options should include Google and OpenStreetMap.
- Clicking on one of these will add a new layer, which can be seen in the Layers menu.
- The basemap now obscures the other layers you have added. Go to the layers panel and drag the basemap to the bottom of the list of layers. The Basemap will now appear below the other layers.
Now save your work. Save your work regularly.
3.5 Summary
Before moving on to the next chapter make sure you have.
- Downloaded the example data
- Imported the files to QGIS
- Added a basemap
Bonus Exercises
- Read about the disadvantages of shapefile and some of the alteratives http://switchfromshapefile.org/
- In the course data folder, there is a copy of the “Access_DeprivationLeeds” file in Geopackage format. Have a go at loading this layer into QGIS. the polygons may be a different colour to the shapefile, but it should cover the same area.