# load packages
library(tidyverse)
── Attaching core tidyverse packages ──────────────────────── tidyverse 2.0.0 ──
✔ dplyr     1.1.4     ✔ readr     2.1.5
✔ forcats   1.0.0     ✔ stringr   1.5.1
✔ ggplot2   3.5.1     ✔ tibble    3.2.1
✔ lubridate 1.9.4     ✔ tidyr     1.3.1
✔ purrr     1.0.4     
── Conflicts ────────────────────────────────────────── tidyverse_conflicts() ──
✖ dplyr::filter() masks stats::filter()
✖ dplyr::lag()    masks stats::lag()
ℹ Use the conflicted package (<http://conflicted.r-lib.org/>) to force all conflicts to become errors

Hello this is some text.

casualty_type = c("cat", "dog", "person")
casualty_age = seq(from = 20, to = 60, by = 20)
crashes = data.frame(casualty_type, casualty_age)
plot(crashes$casualty_age)

Subsetting.

crashes$casualty_type
[1] "cat"    "dog"    "person"
crashes[[1]]
[1] "cat"    "dog"    "person"
crashes[2,1]
[1] "dog"
crashes |>
  select(casualty_type)
  casualty_type
1           cat
2           dog
3        person
crashes |> 
  filter(casualty_age > 35)
  casualty_type casualty_age
1           dog           40
2        person           60
crashes |> 
  filter(casualty_age-20 > 35)
  casualty_type casualty_age
1        person           60
crashes |>
  ggplot() +
  geom_bar(aes(x = casualty_age, fill = casualty_type))

ac = stats19::get_stats19(year = 2020, type = "collision")
Files identified: dft-road-casualty-statistics-collision-2020.csv
   https://data.dft.gov.uk/road-accidents-safety-data/dft-road-casualty-statistics-collision-2020.csv
Data saved at /tmp/Rtmp5HpKAp/dft-road-casualty-statistics-collision-2020.csv
Reading in: 
/tmp/Rtmp5HpKAp/dft-road-casualty-statistics-collision-2020.csv
date and time columns present, creating formatted datetime column
class(ac)
[1] "spec_tbl_df" "tbl_df"      "tbl"         "data.frame" 
dim(ac)
[1] 91199    38
ac_2021 = stats19::get_stats19(year = 2021, type = "collision")
Files identified: dft-road-casualty-statistics-collision-2021.csv
   https://data.dft.gov.uk/road-accidents-safety-data/dft-road-casualty-statistics-collision-2021.csv
Data saved at /tmp/Rtmp5HpKAp/dft-road-casualty-statistics-collision-2021.csv
Reading in: 
/tmp/Rtmp5HpKAp/dft-road-casualty-statistics-collision-2021.csv
date and time columns present, creating formatted datetime column
nrow(ac)
[1] 91199
nrow(ac_2021)
[1] 101087
# # After googling "combine 2 data frames" let's try rbind
# ??combine
# ?rbind
ac = rbind(ac, ac_2021)
dim(ac)
[1] 192286     38
ac_datetime = c(ac$datetime, ac_2021$datetime)
length(ac_datetime)
[1] 293373
range(ac_datetime)
[1] "2020-01-01 00:01:00 GMT" "2021-12-31 23:55:00 GMT"
class(ac)
[1] "spec_tbl_df" "tbl_df"      "tbl"         "data.frame" 
str(ac)
spc_tbl_ [192,286 × 38] (S3: spec_tbl_df/tbl_df/tbl/data.frame)
 $ accident_index                             : chr [1:192286] "2020010219808" "2020010220496" "2020010228005" "2020010228006" ...
 $ accident_year                              : int [1:192286] 2020 2020 2020 2020 2020 2020 2020 2020 2020 2020 ...
 $ accident_reference                         : chr [1:192286] "010219808" "010220496" "010228005" "010228006" ...
 $ location_easting_osgr                      : int [1:192286] 521389 529337 526432 538676 529324 537193 539764 536115 530876 529718 ...
 $ location_northing_osgr                     : int [1:192286] 175144 176237 182761 184371 181286 177105 179234 182297 191335 192342 ...
 $ longitude                                  : int [1:192286] NA NA NA NA NA NA NA NA NA NA ...
 $ latitude                                   : int [1:192286] NA NA NA NA NA NA NA NA NA NA ...
 $ police_force                               : chr [1:192286] "Metropolitan Police" "Metropolitan Police" "Metropolitan Police" "Metropolitan Police" ...
 $ accident_severity                          : chr [1:192286] "Slight" "Slight" "Slight" "Serious" ...
 $ number_of_vehicles                         : chr [1:192286] "1" "1" "1" "1" ...
 $ number_of_casualties                       : chr [1:192286] "1" "2" "1" "1" ...
 $ date                                       : Date[1:192286], format: "2020-02-04" "2020-04-27" ...
 $ day_of_week                                : chr [1:192286] "Tuesday" "Monday" "Wednesday" "Wednesday" ...
 $ time                                       : chr [1:192286] "09:00" "13:55" "01:25" "01:50" ...
 $ local_authority_district                   : chr [1:192286] "Wandsworth" "Lambeth" "Westminster" "Newham" ...
 $ local_authority_ons_district               : chr [1:192286] "Wandsworth" "Lambeth" "Westminster" "Newham" ...
 $ local_authority_highway                    : chr [1:192286] "Wandsworth" "Lambeth" "Westminster" "Newham" ...
 $ first_road_class                           : chr [1:192286] "Unclassified" "A" "C" "A" ...
 $ first_road_number                          : chr [1:192286] "first_road_class is C or Unclassified. These roads do not have official numbers so recorded as zero" "3036" "first_road_class is C or Unclassified. These roads do not have official numbers so recorded as zero" "11" ...
 $ road_type                                  : chr [1:192286] "Single carriageway" "Single carriageway" "Single carriageway" "Single carriageway" ...
 $ speed_limit                                : chr [1:192286] "20" "20" "30" "30" ...
 $ junction_detail                            : chr [1:192286] "Not at junction or within 20 metres" "Other junction" "T or staggered junction" "Not at junction or within 20 metres" ...
 $ junction_control                           : chr [1:192286] "Data missing or out of range" "Auto traffic signal" "Authorised person" "Data missing or out of range" ...
 $ second_road_class                          : chr [1:192286] "Not at junction or within 20 metres" "Unclassified" "Unclassified" "Not at junction or within 20 metres" ...
 $ second_road_number                         : chr [1:192286] "Unknown" "first_road_class is C or Unclassified. These roads do not have official numbers so recorded as zero" "first_road_class is C or Unclassified. These roads do not have official numbers so recorded as zero" "Unknown" ...
 $ pedestrian_crossing_human_control          : chr [1:192286] "unknown (self reported)" "None within 50 metres" "None within 50 metres" "None within 50 metres" ...
 $ pedestrian_crossing_physical_facilities    : chr [1:192286] "unknown (self reported)" "Pelican, puffin, toucan or similar non-junction pedestrian light crossing" "No physical crossing facilities within 50 metres" "Pelican, puffin, toucan or similar non-junction pedestrian light crossing" ...
 $ light_conditions                           : chr [1:192286] "Daylight" "Daylight" "Darkness - lights lit" "Darkness - lights lit" ...
 $ weather_conditions                         : chr [1:192286] "Unknown" "Fine no high winds" "Fine no high winds" "Fine no high winds" ...
 $ road_surface_conditions                    : chr [1:192286] "unknown (self reported)" "Dry" "Wet or damp" "Dry" ...
 $ special_conditions_at_site                 : chr [1:192286] "None" "None" "None" "None" ...
 $ carriageway_hazards                        : chr [1:192286] "None" "None" "None" "None" ...
 $ urban_or_rural_area                        : chr [1:192286] "Urban" "Urban" "Urban" "Urban" ...
 $ did_police_officer_attend_scene_of_accident: chr [1:192286] "No - accident was reported using a self completion  form (self rep only)" "Yes" "Yes" "Yes" ...
 $ trunk_road_flag                            : chr [1:192286] "Non-trunk" "Non-trunk" "Non-trunk" "Non-trunk" ...
 $ lsoa_of_accident_location                  : chr [1:192286] "E01004576" "E01003034" "E01004726" "E01003617" ...
 $ enhanced_severity_collision                : num [1:192286] -1 -1 -1 -1 -1 -1 -1 -1 -1 -1 ...
 $ datetime                                   : POSIXct[1:192286], format: "2020-02-04 09:00:00" "2020-04-27 13:55:00" ...
 - attr(*, "spec")=
  .. cols(
  ..   accident_index = col_character(),
  ..   accident_year = col_integer(),
  ..   accident_reference = col_character(),
  ..   location_easting_osgr = col_integer(),
  ..   location_northing_osgr = col_integer(),
  ..   longitude = col_integer(),
  ..   latitude = col_integer(),
  ..   police_force = col_character(),
  ..   accident_severity = col_character(),
  ..   number_of_vehicles = col_character(),
  ..   number_of_casualties = col_character(),
  ..   date = col_character(),
  ..   day_of_week = col_character(),
  ..   time = col_character(),
  ..   local_authority_district = col_character(),
  ..   local_authority_ons_district = col_character(),
  ..   local_authority_highway = col_character(),
  ..   first_road_class = col_character(),
  ..   first_road_number = col_character(),
  ..   road_type = col_character(),
  ..   speed_limit = col_character(),
  ..   junction_detail = col_character(),
  ..   junction_control = col_character(),
  ..   second_road_class = col_character(),
  ..   second_road_number = col_character(),
  ..   pedestrian_crossing_human_control = col_character(),
  ..   pedestrian_crossing_physical_facilities = col_character(),
  ..   light_conditions = col_character(),
  ..   weather_conditions = col_character(),
  ..   road_surface_conditions = col_character(),
  ..   special_conditions_at_site = col_character(),
  ..   carriageway_hazards = col_character(),
  ..   urban_or_rural_area = col_character(),
  ..   did_police_officer_attend_scene_of_accident = col_character(),
  ..   trunk_road_flag = col_character(),
  ..   lsoa_of_accident_location = col_character(),
  ..   enhanced_severity_collision = col_double()
  .. )
 - attr(*, "problems")=<externalptr> 
names(ac)
 [1] "accident_index"                             
 [2] "accident_year"                              
 [3] "accident_reference"                         
 [4] "location_easting_osgr"                      
 [5] "location_northing_osgr"                     
 [6] "longitude"                                  
 [7] "latitude"                                   
 [8] "police_force"                               
 [9] "accident_severity"                          
[10] "number_of_vehicles"                         
[11] "number_of_casualties"                       
[12] "date"                                       
[13] "day_of_week"                                
[14] "time"                                       
[15] "local_authority_district"                   
[16] "local_authority_ons_district"               
[17] "local_authority_highway"                    
[18] "first_road_class"                           
[19] "first_road_number"                          
[20] "road_type"                                  
[21] "speed_limit"                                
[22] "junction_detail"                            
[23] "junction_control"                           
[24] "second_road_class"                          
[25] "second_road_number"                         
[26] "pedestrian_crossing_human_control"          
[27] "pedestrian_crossing_physical_facilities"    
[28] "light_conditions"                           
[29] "weather_conditions"                         
[30] "road_surface_conditions"                    
[31] "special_conditions_at_site"                 
[32] "carriageway_hazards"                        
[33] "urban_or_rural_area"                        
[34] "did_police_officer_attend_scene_of_accident"
[35] "trunk_road_flag"                            
[36] "lsoa_of_accident_location"                  
[37] "enhanced_severity_collision"                
[38] "datetime"                                   
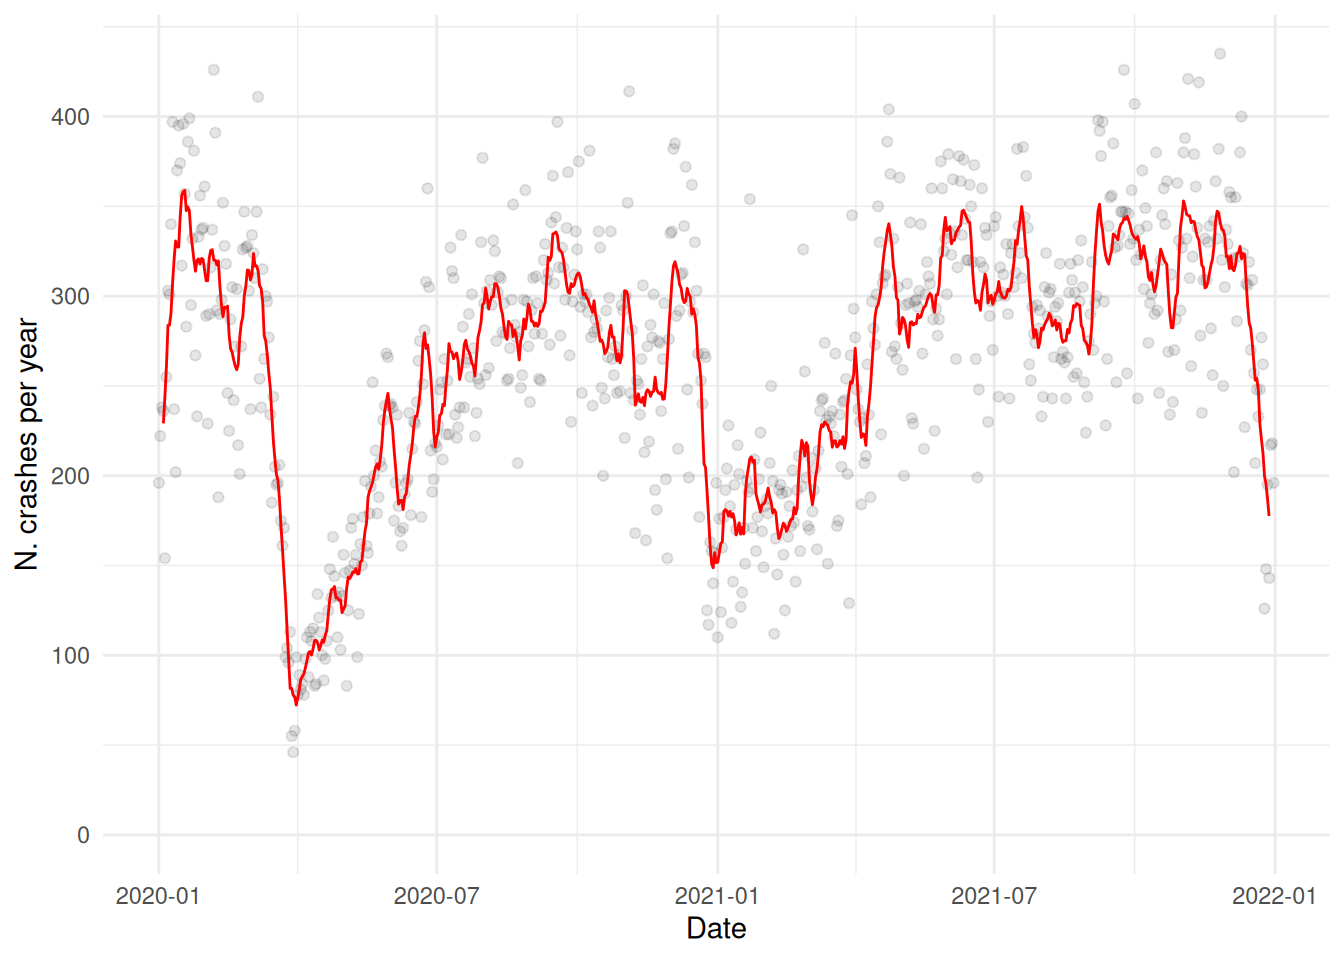
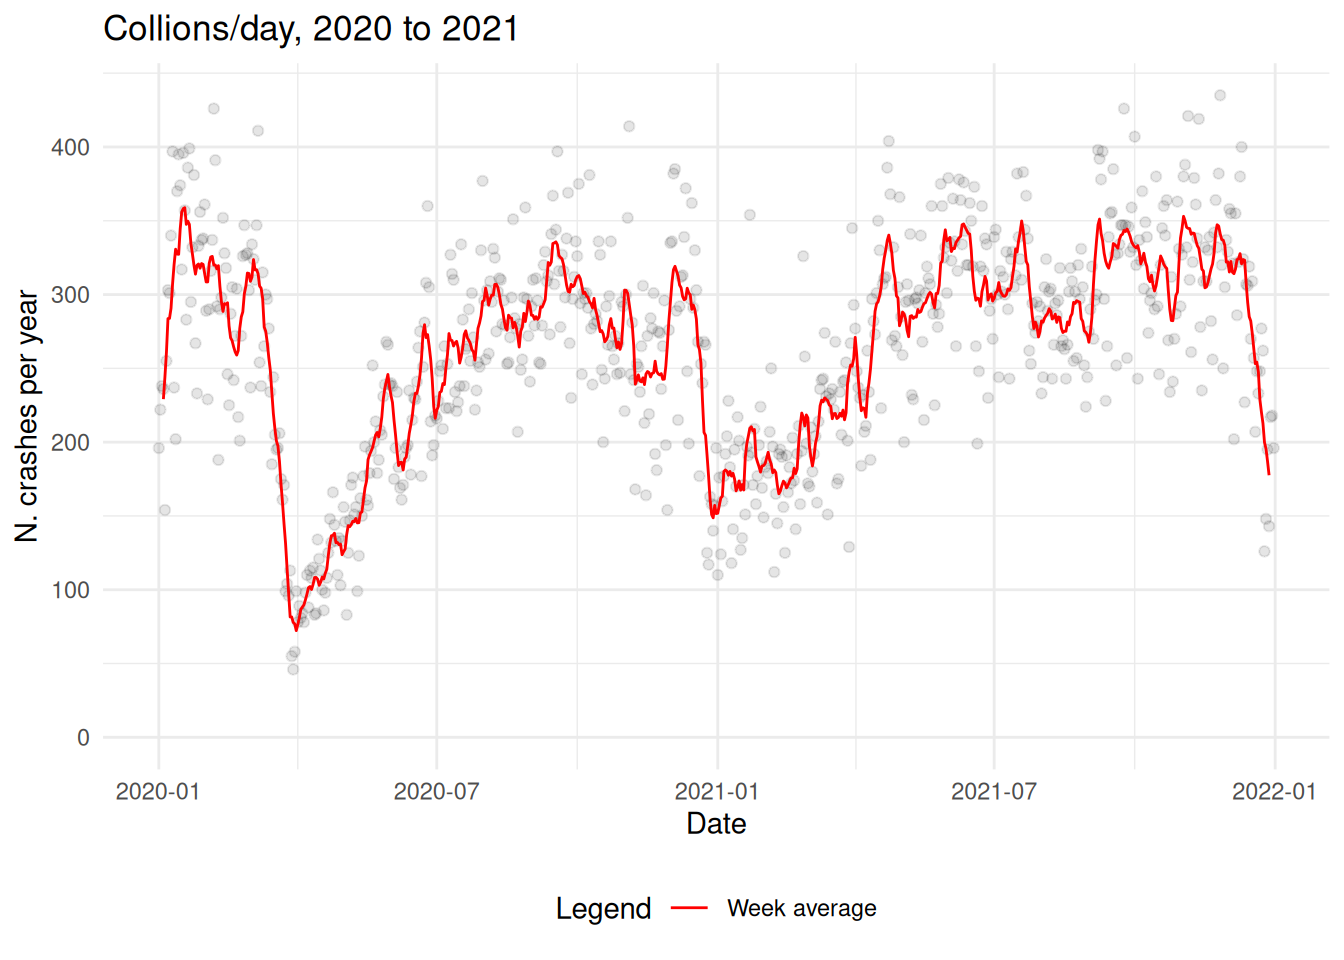
# aggregate this by day to show 
# how crash numbers varied over the year
ac_by_year = ac |>
  group_by(date) |>
  summarise(
    n_crashes = n()
  )
ac_by_year |>
  mutate(
    `N. crashes per year` = n_crashes,
    `Week average` = zoo::rollmean(n_crashes, 7, na.pad = TRUE),
    Date = date,
  ) |> 
  ggplot(aes(x = Date, y = `N. crashes per year`)) +
  geom_point(alpha = 0.1) +
  ylim(c(0, NA)) +
  # geom_smooth() +
  # weekly rolling average
  geom_line(aes(Date, `Week average`), colour = "red") +
  theme_minimal()
Warning: Removed 6 rows containing missing values or values outside the scale range
(`geom_line()`).

# Updated plot with title and legend...
ac_by_year |>
  mutate(
    `N. crashes per year` = n_crashes,
    `Week average` = zoo::rollmean(n_crashes, 7, na.pad = TRUE),
    Date = date,
  ) |> 
  ggplot(aes(x = Date, y = `N. crashes per year`)) +
  geom_point(alpha = 0.1) +
  ylim(c(0, NA)) +
  # geom_smooth() +
  # weekly rolling average
  geom_line(aes(Date, `Week average`, colour = "Week average")) +
  theme_minimal() +
  labs(
    colour = "Legend"
  ) +
  scale_colour_manual(values = c("Week average" = "red")) +
  ggtitle("Collions/day, 2020 to 2021") +
  theme(
    legend.position = "bottom"
  )
Warning: Removed 6 rows containing missing values or values outside the scale range
(`geom_line()`).

1 Python example

casualty_type_py = ["a", "B", "c"]
casualty_type_py
['a', 'B', 'c']