pkgs = c("tidyverse", "stats19")
# Install pak pkg if not already installed
if (!requireNamespace("pak", quietly = TRUE)) install.packages("pak")
pak::pkg_install(pkgs)

#| label: setup
#| message: false
#| warning: false
#| output: false
library(tidyverse)
library(stats19)
# Set ggplot2 theme
theme_set(theme_minimal())
collisions_2023 = stats19::get_stats19(year = 2023, type = "collision")
collisions_2023_sf = stats19::format_sf(collisions_2023)
class(collisions_2023_sf)
names(collisions_2023_sf)[1:9]
head(table(collisions_2023_sf$police_force))
collisions_west_yorkshire_sf = collisions_2023_sf |>
  filter(police_force == "West Yorkshire") |>
  # Arrange in descending order of accident severity
  # so most severe accidents are plotted last:
arrange(desc(collision_severity))Reproducible data science for road safety research
Introduction
This workshop will take place at the University of Leeds’ Institute for Transport Studies (ITS) as part of the RS5C conference that runs from 3rd to 5th September 2025. The workshop takes place on the 2nd September 2025, 13:00-16:00 (including 1 hour for a networking lunch), the day before the main conference starts.
The workshop will cover the fundamentals of reproducible data science for road safety research, building on a decade’s worth of experience working with road traffic casualty datasets for policy-relevant road safety research. The UK’s open access STATS19 database will be the basis of the session but the skills learned will be applicable to any road safety datasets. The session will cover:
- Importing collision, casualty and vehicle tables: See Chapter 4 on R packages and Chapter 8 on joining tables.
- Temporal visualisation and aggregation: See Chapter 6 on temporal data.
- Spatial visualisation and aggregation: See Chapter 7 on spatial data.
- Joining STATS19 tables: See Chapter 8 on joining tables.
- Spatial joins linking infrastructure to collisions: See Chapter 7 on spatial data.
The course will be taught in R, a free and open-source programming language for data analysis and visualisation that excels at the kind of statistical modelling and visualisation workflows required for high-impact, reproducible and correct road safety research. The course will be taught by Professor Robin Lovelace, who has over a decade of experience teaching R for data science and is author of the popular book Geocomputation with R. You will learn how to add value to road traffic casualty date for more data-driven and effective interventions to save lives in relation to the largest cause of death for young people worldwide, as highlighted in the map below.
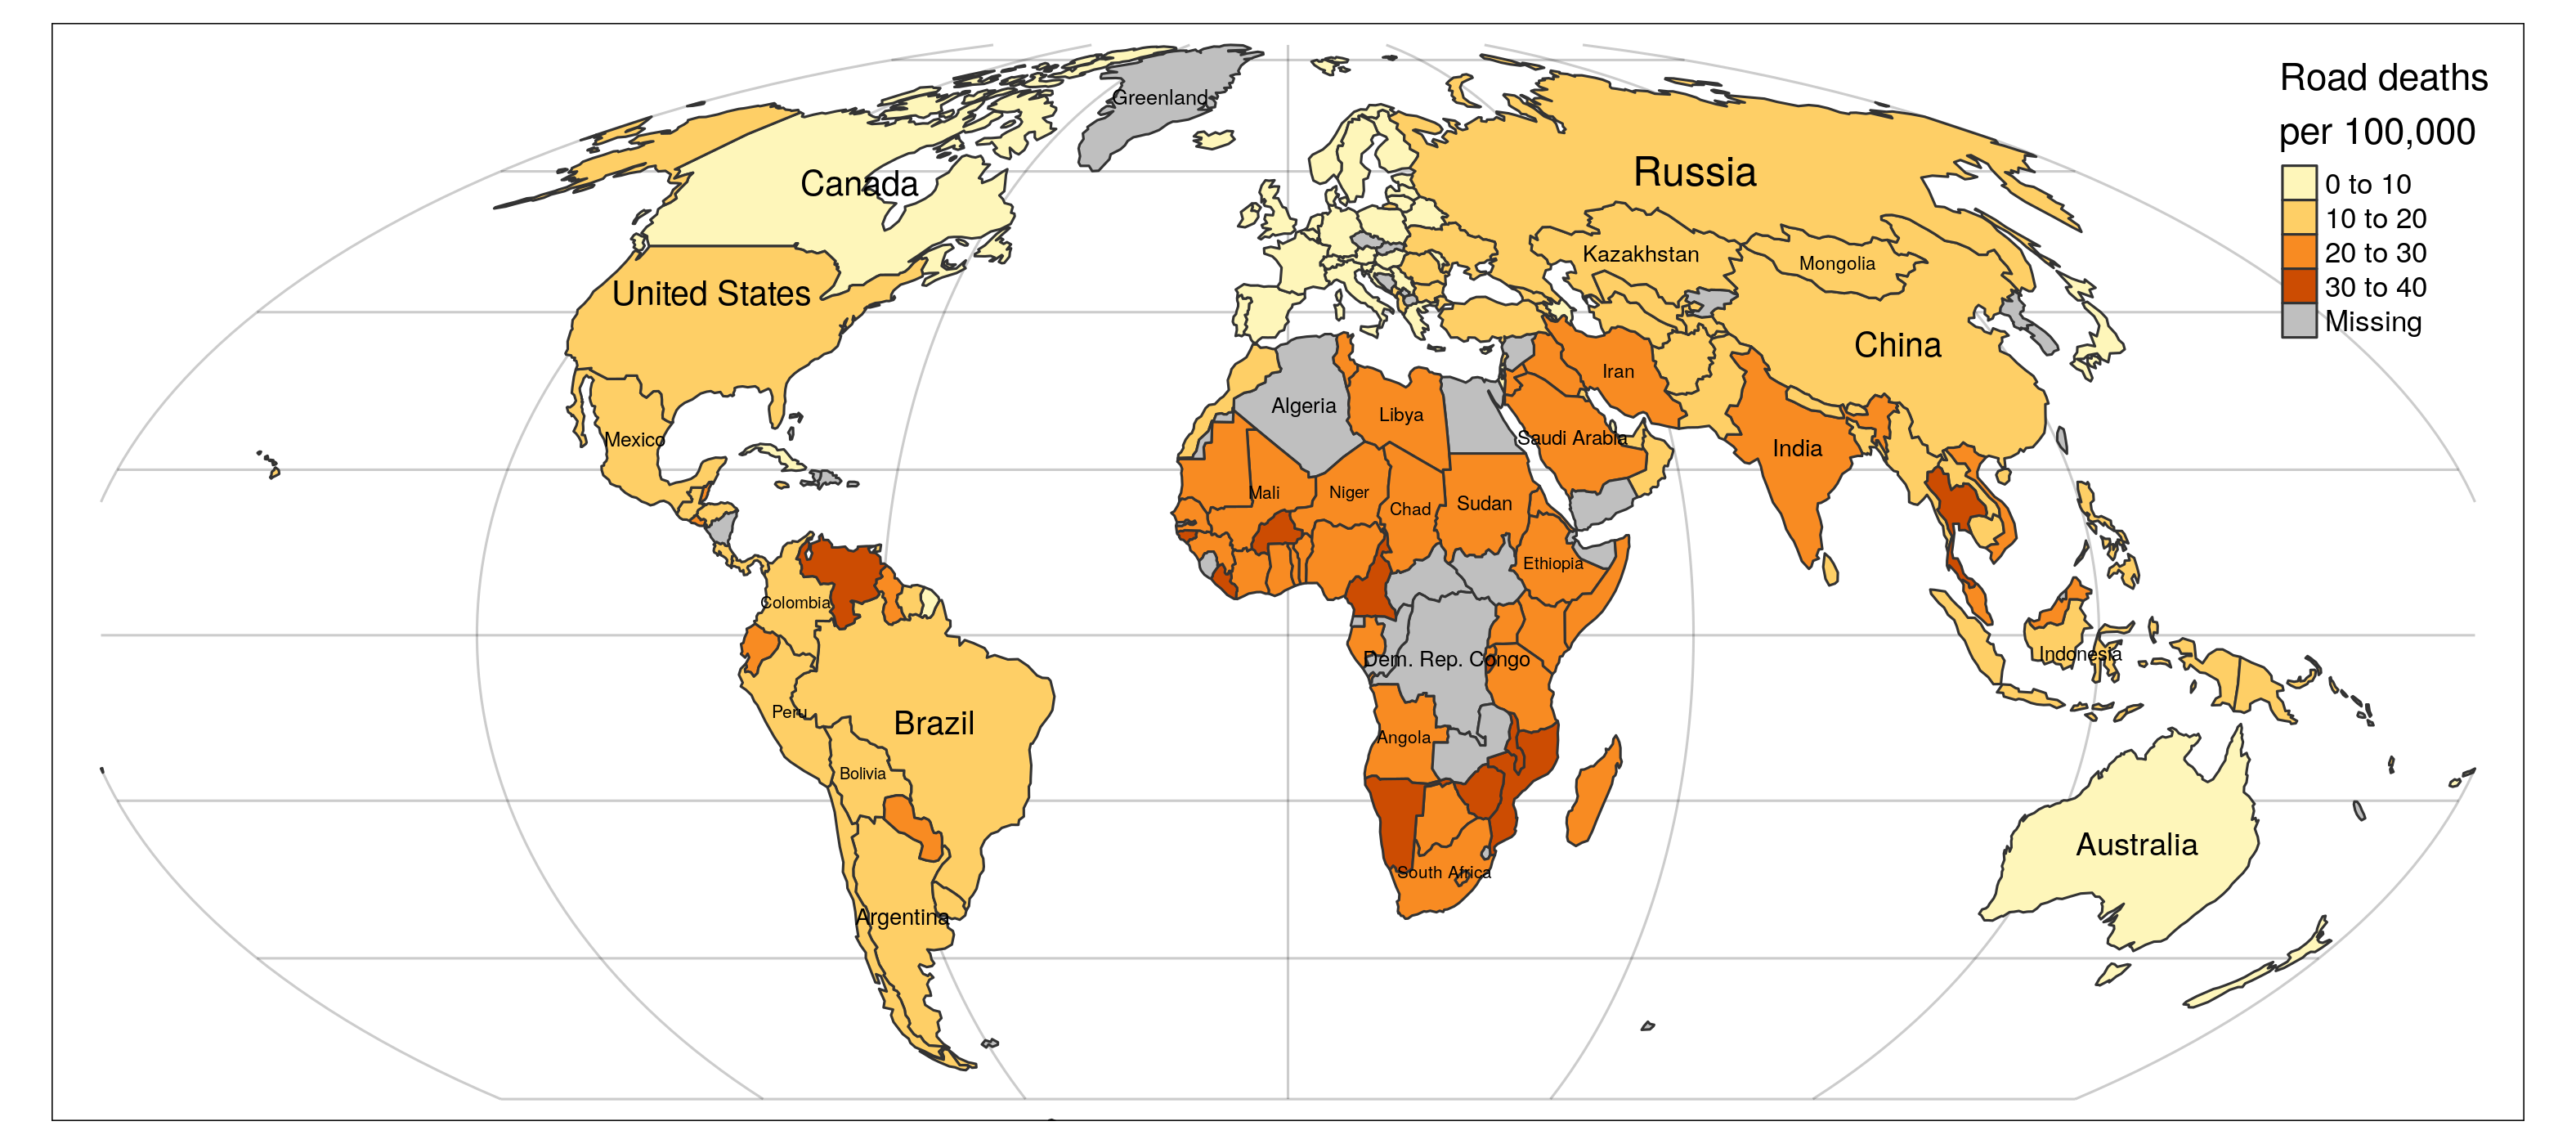
Road danger levels worldwide in 2016. Data source: World Bank. Reproducible source code: Reproducible Road Safety Research with R, freely available at itsleeds.github.io/rrsrr/.
Who is this for?
The workshop is aimed at anyone interested in road safety research, especially for students, researchers, and practitioners who are already working with road safety data and who would like to improve their data science skills for more reproducible and impactful research.
You are welcome to sign-up and learn from the session if you are new to R or if you want to work through the practical content in another language such as Python or Julia. However, the session will be most useful if you have some prior experience with R and RStudio (see links below for recommended reading and places to learn R). We highly recommend that attendees already use R or dedicate some time to learning the basics of R before the session.
Prerequisites
Attendees should have the following before signing-up:
- A GitHub account, which will enable you to run the course via a web browser by clicking on the link below.
![]()
- Basic familiarity with R and RStudio or knowledge of another programming language for data science
- A laptop with R and RStudio installed (or VS Code with the R extension or similar for advanced users)
- Docker installed if you plan to use VS Code and devcontainers for full reproducibility
- A willingness to learn (see recommended reading) and share knowledge
To check you have the necessary software installed, try running the following, which should result in the figure below.
ggplot() +
  geom_sf(
    data = collisions_west_yorkshire_sf,
    aes(colour = collision_severity, alpha = collision_severity)
  ) +
  scale_alpha_manual(values = c(0.8, 0.4, 0.2))
If you cannot reproduce the above code or have any issues with setting up your environment, or any questions about the course, feel free to get in touch via the GitHub Discussions (also requires a GitHub account).
Recommended reading
The session will build on the following resources, we recommend taking a read of one or more of these before signing-up:
- The first practical session of the Transport Data Science module, freely available at itsleeds.github.io/tds/s1/, for an introduction to data science for transport research
- Reproducible Road Safety Research with R (Lovelace, 2020)
- Introductory guide for analyzing road safety data in R
- Geocomputation with R and Chapter 13 in particular (Lovelace et al., 2025)
- A paper exploring the spatial distribution of cycling casualties in West Yorkshire, using exploratory data analysis (EDA) techniques (Lovelace et al., 2016)
- A paper exploring social inequalities in cycling casualties nationwide (Vidal Tortosa et al., 2021)
- Papers investigating the relationships between new contraflow interventions and traffic levels and collision rates in London (Tait et al., 2024, 2023)
Where and when
2nd September 2025, 13:00-16:00, Room 1.11, ITS, University of Leeds:
Agenda
- 13:00-14:00 Networking lunch
- 14:00-14:15 Introduction to reproducible research for road traffic harm reduction research (Robin Lovelace, University of Leeds)
- 14:15-14:30 New datasets and tools for understanding and defeating the causes of road danger (Richard Owen, Agilysis)
- 14:30-16:00 Workshop (Robin Lovelace, Juan Pablo Fonseca Zamora, Caroline Tait, University of Leeds)
- 16:00-16:15 Post workshop networking and social, downtime
- 16:15-16:45 Walk to the Cloth Hall Courth for the RS5C drinks reception
Workshop tasks
See workshop slides at slides/road-safety.html.
Importing collision, casualty and vehicle tables (20 min)
- Learn how to load the main STATS19 tables (collision, casualty, vehicle) using the
stats19R package. - Explore the structure and key variables in each table.
- See Chapter 4 on R packages and Chapter 8 on joining tables for details.
Temporal visualisation and aggregation (20 min)
- Aggregate collision data by time (e.g., by month or day of week).
- Create time series plots to identify trends and patterns.
- See Chapter 6 on temporal data.
Spatial visualisation and aggregation (30 min)
- Convert collision data to spatial format and plot on a map.
- Aggregate collisions by area (e.g., by local authority or police force).
- Create maps to visualise spatial patterns in road safety data.
- See Chapter 7 on spatial data.
Joining STATS19 tables (20 min)
- Join collision, casualty, and vehicle tables to enrich your analysis.
- Explore relationships between different aspects of road traffic incidents.
- See Chapter 8 on joining tables.
Bonuses
We have developed a series of bonus exercises for fast finishers, for people who already have the skills covered in the main workshop, or for anyone who wants to go the extra mile. So feel free to work on these bonus exercises if you:
- Complete the main tasks early, or
- Think you will learn more by exploring additional resources or tackling more complex problems, and
- Feel free to continue working on these bonus exercises after the workshop ends, there is plenty of work represented here, especially in Bonus 4, and we’re not expecting anyone to develop an entire R/Python package during the 1.5 hour workshop!
These tasks are also designed to support people managing others or developing teaching/research programs to think about tasks and activities to assign to their students or teams.
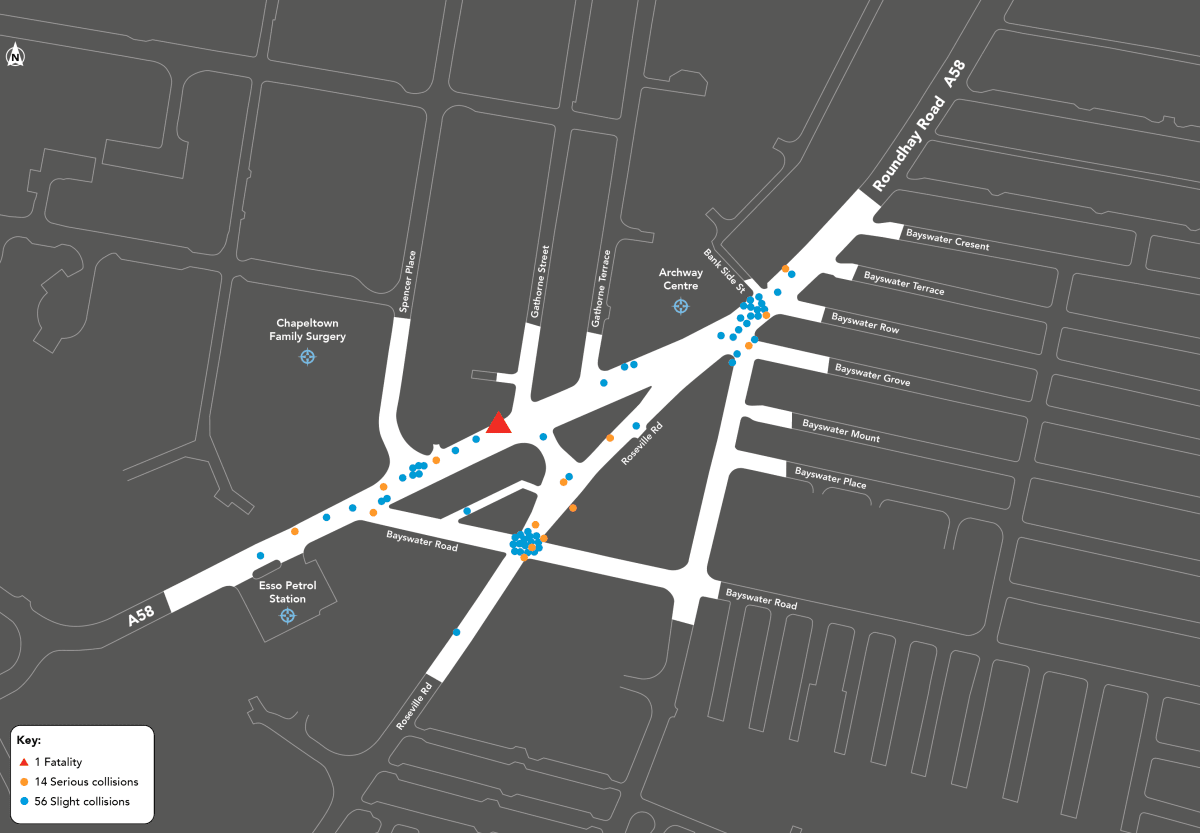
Bonus 2 (intermediate): reproducing a map used in consultation by Leeds City Council
See https://tdscience.github.io/course/collisions.html and reproduce the following map on your own set-up:
Bonus 3 (advanced): analysing collision data to answer a research question
- Formulate a research question related to road safety (e.g., “How do cycle lanes impact collision rates?”).
- Decide a spatial and temporal extent for the study (e.g. Birmingham, 2020-2023)
- Generate as many informative visualisations as possible to explore the data, using any technique you want, e.g.:
- Use the osmactive R package to download cycle lane data from OpenStreetMap.
- Perform spatial joins to link collision locations with infrastructure data (e.g., cycle lanes, speed limits).
- Analyse how infrastructure relates to collision patterns.
- See Chapter 7 on spatial data.
Bonus 4 (advanced): contribute upstream
- Contribute to an existing codebase for making road safety data easier to access for reproducible research.
- For example, you could open an issue in the stats19 repository.
- Or find a related project that could benefit from your expertise and contribute to it, by first opening an issue.
- Propose a new project or feature that could help improve road safety data analysis.
- Propose a new codebase to enable reproducible access to analysis-ready road traffic casualty data in a part of the world you are interested in outside the UK.
- Feel free to open a Discussion thread at github.com/itsleeds/tds/discussions
Prize
For completing bonus activities and sharing them with others, a free copy of Geocomputation with R Second Edition or Geocomputation with Python will be made available.
Sign-up!
Sign-up (£50) at the University of Leeds conference website at eu.eventscloud.com/ereg/newreg.php?eventid=200280778
References
Lovelace, R., 2020. Reproducible road safety research with R. RAC Foundation.
Lovelace, R., Nowosad, J., Münchow, J., 2025. Geocomputation with R. CRC Press.
Lovelace, R., Roberts, H., Kellar, I., 2016. Who, where, when: The demographic and geographic distribution of bicycle crashes in west yorkshire. Transportation Research Part F: Traffic Psychology and Behaviour, Bicycling and bicycle safety 41, Part B. https://doi.org/10.1016/j.trf.2015.02.010
Tait, C., Beecham, R., Lovelace, R., Barber, S., 2024. Build it but will they come? Exploring the impact of introducing contraflow cycling on cycling volumes with crowd-sourced data. Journal of Transport & Health 35, 101758. https://doi.org/10.1016/j.jth.2024.101758
Tait, C., Beecham, R., Lovelace, R., Barber, S., 2023. Contraflows and cycling safety: Evidence from 22 years of data involving 508 one-way streets. Accident Analysis & Prevention 179, 106895. https://doi.org/10.1016/j.aap.2022.106895
Vidal Tortosa, E., Lovelace, R., Heinen, E., Mann, R.P., 2021. Socioeconomic inequalities in cycling safety: An analysis of cycling injury risk by residential deprivation level in england. Journal of Transport & Health 23, 101291. https://doi.org/10.1016/j.jth.2021.101291