library(sf)
library(mapview)
# Read places data
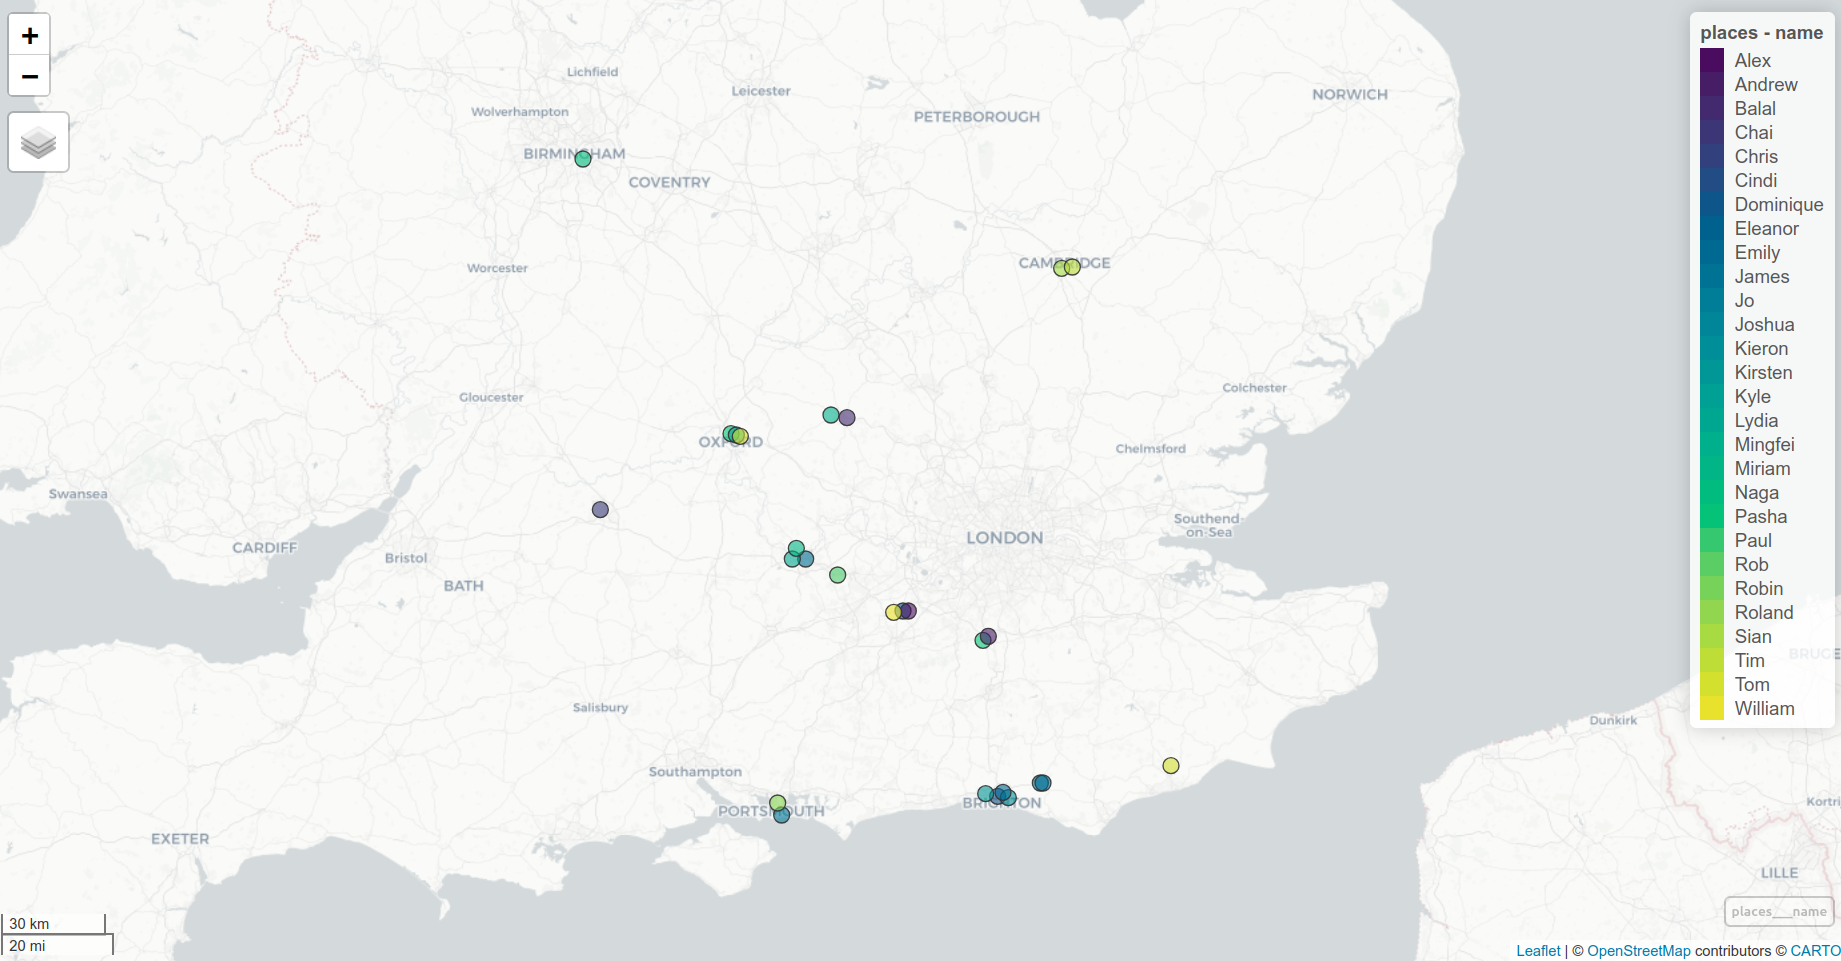
places = read_sf("https://github.com/itsleeds/ai4transport/raw/main/data/places.geojson")
# Visualise places
mapview(places, zcol = "name")Bonus Content
1 Thanks for attending!
We hope you enjoyed the course. You can find all the materials and updates on the course website.
Here is a quick visualisation of the data we explored:
1.1 Places
1.2 OD Data
library(tidyverse)
library(sf)
Download and prepare OD data for TfSE
library(od)

od = read_csv("od_tfse_2021.csv")
zones = read_sf("tfse_msoas.gpkg")

# Check 1st column of zones matches 'o' and 'd' in od
summary(zones[[1]] %in% c(od$o, od$d))
od_sf = od_to_sf(od, zones)
od_sf = od_sf |>
  mutate(`% Car` = Car / (Car + Bicycle + Walking + Bus + Train))
od_sf$length = sf::st_length(od_sf) |> as.numeric()
sf::write_sf(od_sf, "od_tfse_2021_sf.gpkg", delete_dsn = TRUE)
od_sf = read_sf("od_tfse_2021_sf.gpkg")
od_sf |>
filter(Car > 10 & length > 10 * 1000) |>
arrange(desc(`% Car`)) |>
ggplot() +
geom_sf(aes(colour = `% Car`)) +
scale_colour_viridis_c(direction = -1) +
theme_minimal()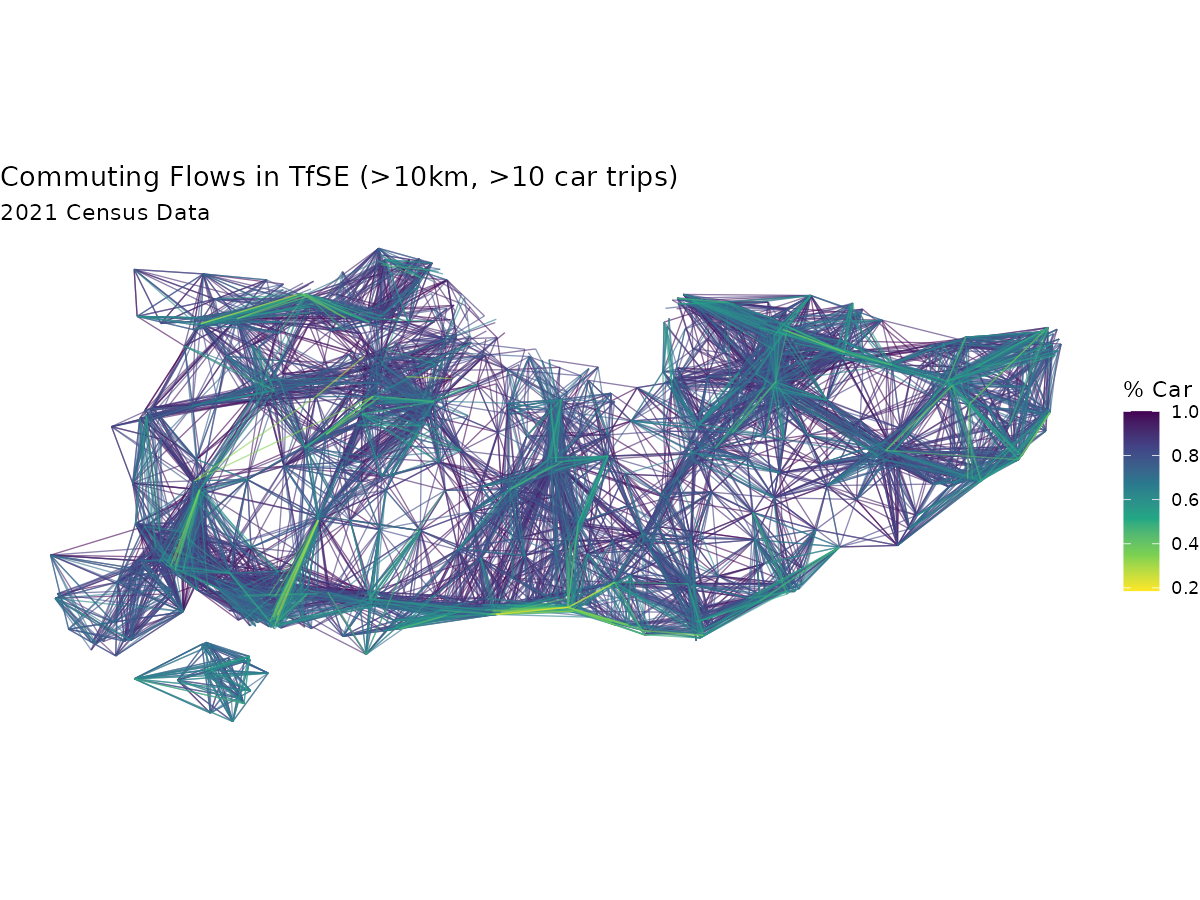
2 Further Learning
We recommend taking Anthropic’s full AI Fluency course to deepen your understanding of AI.
If you want more experience with data science:
- Geocomputation with R, and the Transport chapter in particular
- Geocomputation with Python
3 Get in touch
If you are interested in learning more or collaborating, please get in touch with the team. You can find our email addresses on our institutional profiles:
4 Data Access
You can find details on how to access the data used in this course on the Get Data page.
Reuse
Copyright
© 2025 ITS Leeds