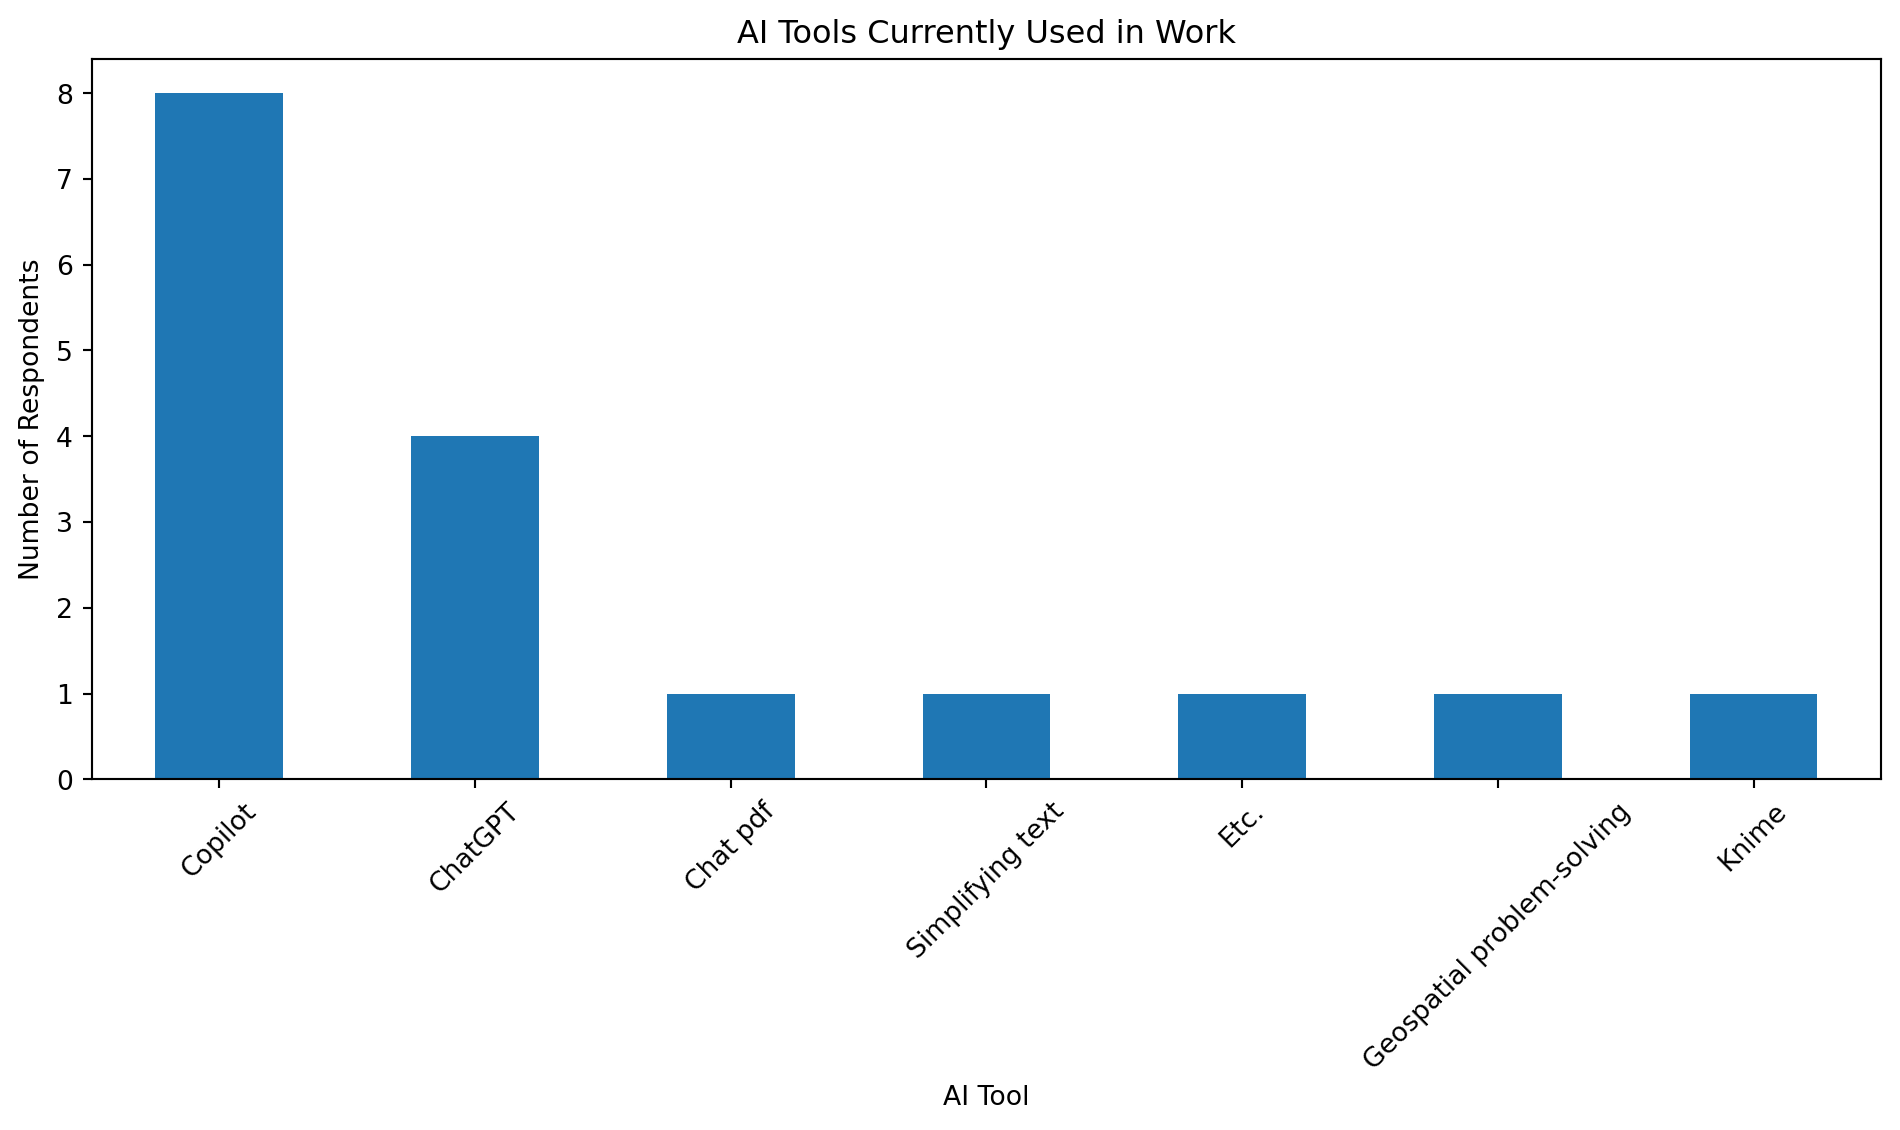
We analyze which AI tools participants are currently using in their work.
Code
from collections import Counterimport matplotlib.pyplot as plt# Find the column for current AI tool usage# Using partial string matching to be robust against column name changesai_tools_col = [c for c in df.columns if"currently use"in c][0]# Drop NaNs and convert to stringstools_series = df[ai_tools_col].dropna().astype(str)# Split multiple entries (assumed comma separated), clean, and flattenall_tools = []for entry in tools_series:# Split by comma tools = entry.split(',')for tool in tools:# Clean whitespace and normalize case tool_clean = tool.strip().lower()# Map common variationsif'copilot'in tool_clean: all_tools.append('Copilot')elif'chatgpt'in tool_clean: all_tools.append('ChatGPT')elif'gemini'in tool_clean: all_tools.append('Gemini')elif'claude'in tool_clean: all_tools.append('Claude')elif'none'in tool_clean or tool_clean ==''or tool_clean =='nan':passelse:# Capitalize first letter for other tools all_tools.append(tool.strip().capitalize())# Count frequenciestool_counts = Counter(all_tools)# Create a DataFrame for better displaytools_df = pd.DataFrame.from_dict(tool_counts, orient='index', columns=['Count']).sort_values('Count', ascending=False)# Display as a markdown tableMarkdown(tools_df.to_markdown(index=True))
Table 1: Most commonly used AI tools in transport planning work.
Count
Copilot
8
ChatGPT
4
Chat pdf
1
Simplifying text
1
Etc.
1
Geospatial problem-solving
1
Knime
1
As shown in Table 1, Copilot and ChatGPT are the dominant tools.
Code
# Simple bar plotplt.figure(figsize=(10, 6))tools_df['Count'].plot(kind='bar')plt.title('AI Tools Currently Used in Work')plt.ylabel('Number of Respondents')plt.xlabel('AI Tool')plt.xticks(rotation=45)plt.tight_layout()plt.show()
Figure 1: Bar chart of AI tools currently used in work.
2 Automation Opportunities
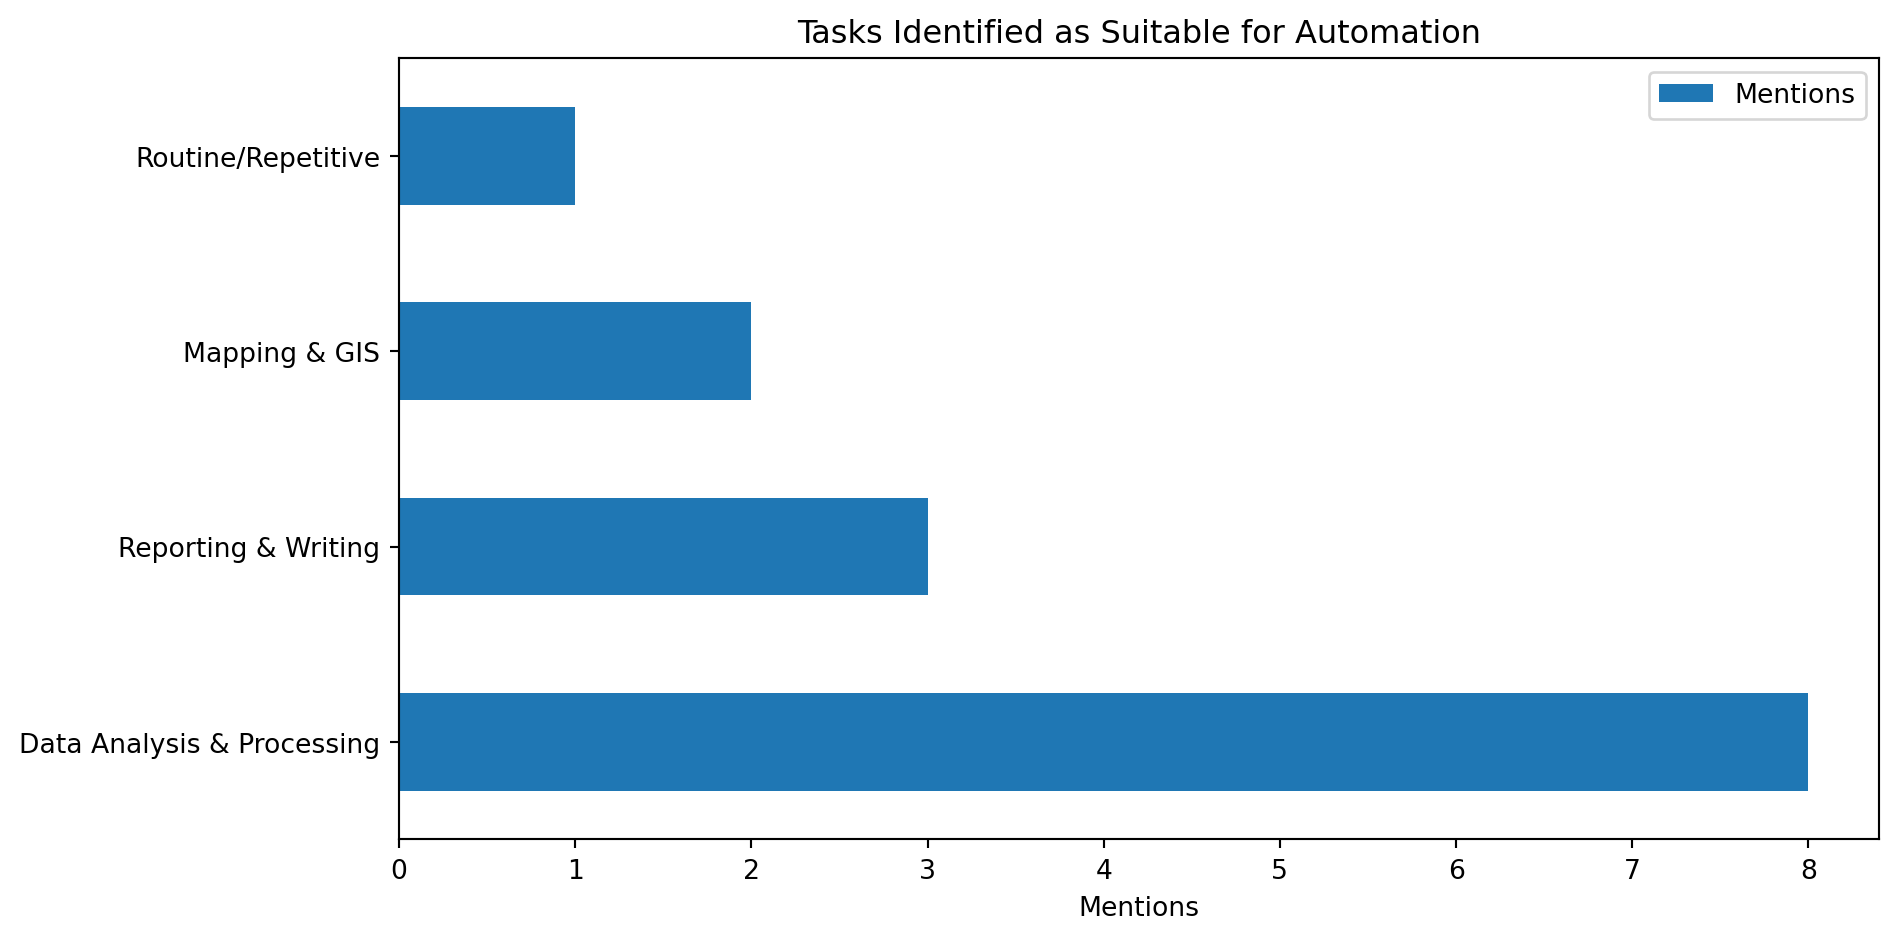
We analyze which tasks participants believe are most suitable for automation.
Code
# Find the column for automationauto_col = [c for c in df.columns if"suitable for automation"in c][0]# Drop NaNsauto_responses = df[auto_col].dropna().astype(str).tolist()# Define keywords to categorize responseskeywords = {"Data Analysis & Processing": ["data", "analysis", "cleaning", "processing", "collection", "formatting", "merging"],"Reporting & Writing": ["report", "writing", "email", "drafting", "summarising"],"Mapping & GIS": ["map", "gis", "spatial", "geo", "coordinates"],"Routine/Repetitive": ["repetitive", "routine", "dashboard"]}category_counts = {k: 0for k in keywords}for response in auto_responses: response_lower = response.lower()for category, keys in keywords.items():ifany(k in response_lower for k in keys): category_counts[category] +=1# Create dataframe for summarycategories_df = pd.DataFrame.from_dict(category_counts, orient='index', columns=['Mentions']).sort_values('Mentions', ascending=False)# Display summary tableMarkdown(categories_df.to_markdown(index=True))
Table 2: Tasks identified as suitable for automation, categorized by theme.
Mentions
Data Analysis & Processing
8
Reporting & Writing
3
Mapping & GIS
2
Routine/Repetitive
1
See Table 2 for the breakdown of tasks. Data-related tasks are the most frequently cited candidates for automation.
Code
# Visualize themescategories_df.plot(kind='barh', figsize=(10, 5))plt.title('Tasks Identified as Suitable for Automation')plt.xlabel('Mentions')plt.tight_layout()plt.show()
Figure 2: Horizontal bar chart of tasks identified as suitable for automation.
---title: "Survey Results"freeze: trueformat: html: code-fold: true code-tools: true---```{python}#| include: falseimport pandas as pdimport osfrom IPython.display import Markdown# Define file pathsinput_file ="Pre-Course Questionnaire(1-13).xlsx"output_file ="results.csv"# Check if input file existsif os.path.exists(input_file):try:# Read Excel file df = pd.read_excel(input_file)# Export to CSV df.to_csv(output_file, index=False)print(f"Successfully converted '{input_file}' to '{output_file}'.")exceptExceptionas e:print(f"Error processing file: {e}")else:# Fallback to reading CSV if Excel is missing but CSV existsif os.path.exists(output_file): df = pd.read_csv(output_file)print(f"Excel file not found, loaded data from '{output_file}'.")else:print(f"File '{input_file}' not found.")```## AI Tool UsageWe analyze which AI tools participants are currently using in their work.```{python}#| label: tbl-ai-tools#| tbl-cap: "Most commonly used AI tools in transport planning work."from collections import Counterimport matplotlib.pyplot as plt# Find the column for current AI tool usage# Using partial string matching to be robust against column name changesai_tools_col = [c for c in df.columns if"currently use"in c][0]# Drop NaNs and convert to stringstools_series = df[ai_tools_col].dropna().astype(str)# Split multiple entries (assumed comma separated), clean, and flattenall_tools = []for entry in tools_series:# Split by comma tools = entry.split(',')for tool in tools:# Clean whitespace and normalize case tool_clean = tool.strip().lower()# Map common variationsif'copilot'in tool_clean: all_tools.append('Copilot')elif'chatgpt'in tool_clean: all_tools.append('ChatGPT')elif'gemini'in tool_clean: all_tools.append('Gemini')elif'claude'in tool_clean: all_tools.append('Claude')elif'none'in tool_clean or tool_clean ==''or tool_clean =='nan':passelse:# Capitalize first letter for other tools all_tools.append(tool.strip().capitalize())# Count frequenciestool_counts = Counter(all_tools)# Create a DataFrame for better displaytools_df = pd.DataFrame.from_dict(tool_counts, orient='index', columns=['Count']).sort_values('Count', ascending=False)# Display as a markdown tableMarkdown(tools_df.to_markdown(index=True))```As shown in @tbl-ai-tools, Copilot and ChatGPT are the dominant tools.```{python}#| label: fig-ai-tools#| fig-cap: "Bar chart of AI tools currently used in work."# Simple bar plotplt.figure(figsize=(10, 6))tools_df['Count'].plot(kind='bar')plt.title('AI Tools Currently Used in Work')plt.ylabel('Number of Respondents')plt.xlabel('AI Tool')plt.xticks(rotation=45)plt.tight_layout()plt.show()```## Automation OpportunitiesWe analyze which tasks participants believe are most suitable for automation.```{python}#| label: tbl-automation#| tbl-cap: "Tasks identified as suitable for automation, categorized by theme."# Find the column for automationauto_col = [c for c in df.columns if"suitable for automation"in c][0]# Drop NaNsauto_responses = df[auto_col].dropna().astype(str).tolist()# Define keywords to categorize responseskeywords = {"Data Analysis & Processing": ["data", "analysis", "cleaning", "processing", "collection", "formatting", "merging"],"Reporting & Writing": ["report", "writing", "email", "drafting", "summarising"],"Mapping & GIS": ["map", "gis", "spatial", "geo", "coordinates"],"Routine/Repetitive": ["repetitive", "routine", "dashboard"]}category_counts = {k: 0for k in keywords}for response in auto_responses: response_lower = response.lower()for category, keys in keywords.items():ifany(k in response_lower for k in keys): category_counts[category] +=1# Create dataframe for summarycategories_df = pd.DataFrame.from_dict(category_counts, orient='index', columns=['Mentions']).sort_values('Mentions', ascending=False)# Display summary tableMarkdown(categories_df.to_markdown(index=True))```See @tbl-automation for the breakdown of tasks. Data-related tasks are the most frequently cited candidates for automation.```{python}#| label: fig-automation#| fig-cap: "Horizontal bar chart of tasks identified as suitable for automation."# Visualize themescategories_df.plot(kind='barh', figsize=(10, 5))plt.title('Tasks Identified as Suitable for Automation')plt.xlabel('Mentions')plt.tight_layout()plt.show()```