Convert a series of points into a dataframe of origins and destinations
Source:R/points_to_od.R
points_to_od.RdTakes a series of geographical points and converts them into a data.frame representing the potential flows, or 'spatial interaction', between every combination of points.
points_to_od(
  p,
  pd = NULL,
  interzone_only = FALSE,
  ids_only = FALSE,
  max_dist = Inf,
  max_dest = Inf
)

points_to_odl(p, pd = NULL, crs = 4326, ...)
Arguments
- p
A spatial points object or a matrix of coordinates representing points
- pd
Optional spatial points object objects representing destinations.
pdis ignored ifpis a matrix. Ifpdis not provided,pis used as the destination points.- interzone_only
Should the result only include interzonal OD pairs, in which the ID of the origin is different from the ID of the destination zone?
FALSEby default- ids_only
Should a data frame with only 2 columns (origin and destination IDs) be returned? The default is
FALSE, meaning the result should also contain the coordinates of the start and end points of each OD pair.- max_dist
Numeric, maximum distance to consider. Default Inf. Not applicable when
pis a matrix.- max_dest
The maximum number of destinations for each origin (numeric) sorted from closest to furthest. Default is Inf. Alternative to max_dist for limiting the number of ODs. Not applicable when
pis a matrix.- crs
The coordinate reference system of the output, if not known in
z. 4326 by default.- ...
Additional arguments passed to
points_to_od)
Details
points_to_odl() generates the same output but returns a geographic object
representing desire lines in the class sf.
Examples
library(sf)
p = od_data_centroids[1:2, ]
points_to_od(p)
#> O D ox oy dx dy
#> 1 E02002407 E02002407 -1.609934 53.79079 -1.609934 53.79079
#> 1.1 E02002407 E02002336 -1.609934 53.79079 -1.624630 53.88605
#> 2 E02002336 E02002407 -1.624630 53.88605 -1.609934 53.79079
#> 2.1 E02002336 E02002336 -1.624630 53.88605 -1.624630 53.88605
points_to_od(p, ids_only = TRUE)
#> O D
#> 1 E02002407 E02002407
#> 2 E02002407 E02002336
#> 3 E02002336 E02002407
#> 4 E02002336 E02002336
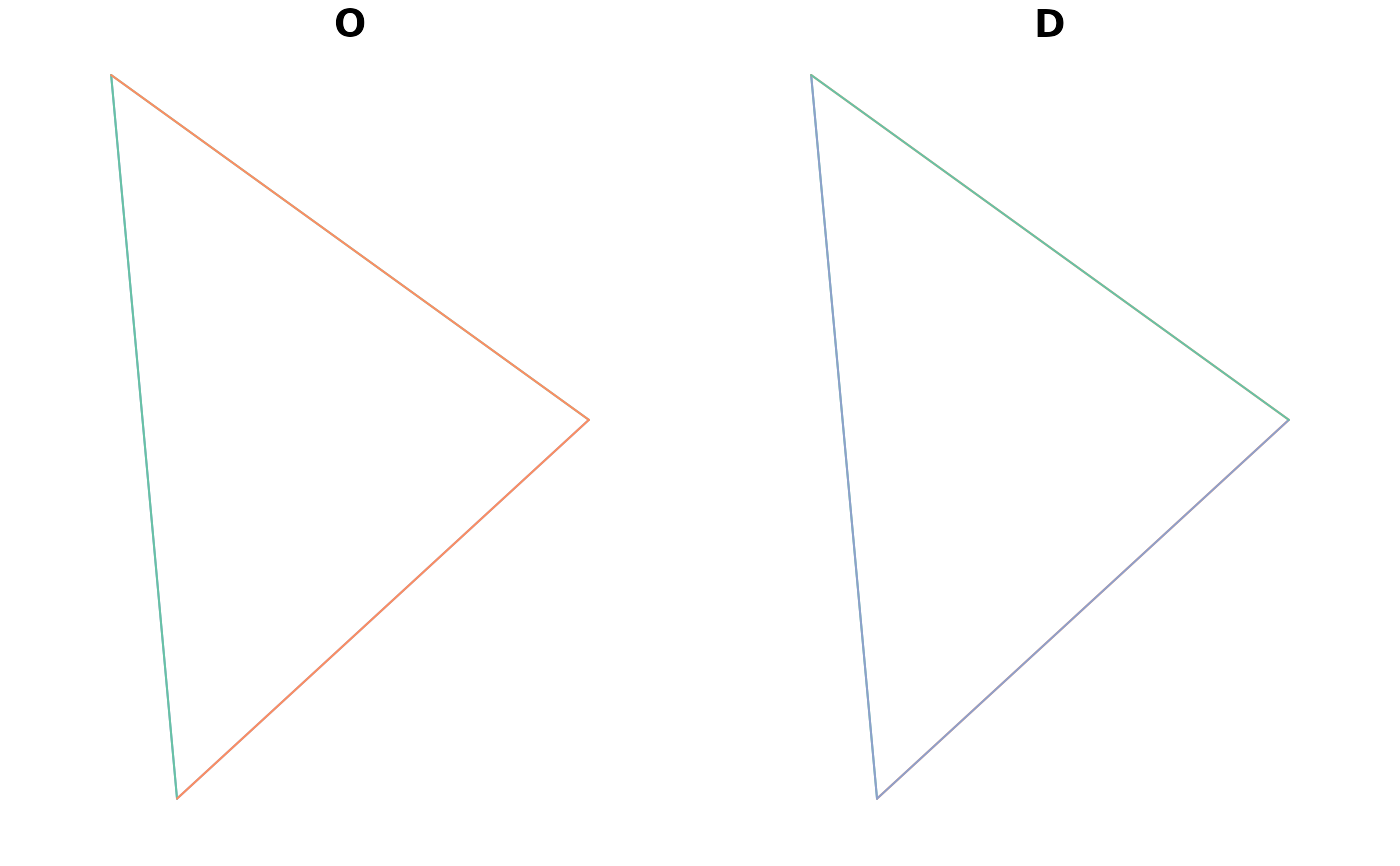
(l = points_to_odl(p, interzone_only = TRUE))
#> Simple feature collection with 2 features and 2 fields
#> Geometry type: LINESTRING
#> Dimension: XY
#> Bounding box: xmin: -1.62463 ymin: 53.79079 xmax: -1.609934 ymax: 53.88605
#> Geodetic CRS: WGS 84
#> O D geometry
#> 1 E02002407 E02002336 LINESTRING (-1.609934 53.79...
#> 2 E02002336 E02002407 LINESTRING (-1.62463 53.886...
plot(l)
 points_to_od(od_data_centroids[1:2, ], od_data_centroids[3, ])
#> O D ox oy dx dy
#> 1 E02002407 E02002353 -1.609934 53.79079 -1.518058 53.84066
#> 2 E02002336 E02002353 -1.624630 53.88605 -1.518058 53.84066
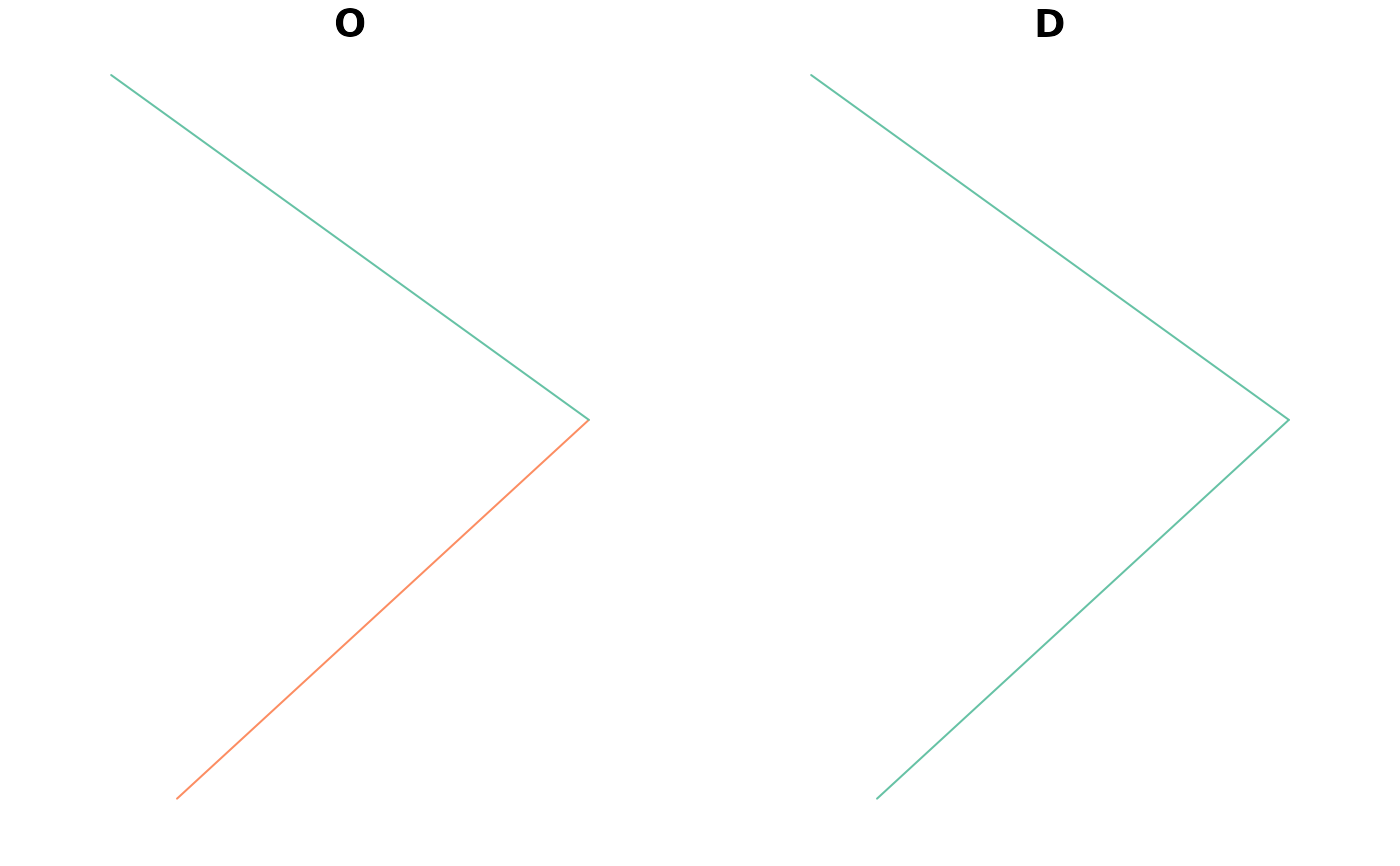
l = points_to_odl(od_data_centroids[1:2, ], od_data_centroids[3, ])
plot(l)
points_to_od(od_data_centroids[1:2, ], od_data_centroids[3, ])
#> O D ox oy dx dy
#> 1 E02002407 E02002353 -1.609934 53.79079 -1.518058 53.84066
#> 2 E02002336 E02002353 -1.624630 53.88605 -1.518058 53.84066
l = points_to_odl(od_data_centroids[1:2, ], od_data_centroids[3, ])
plot(l)
 (od = points_to_od(p, interzone_only = TRUE))
#> O D ox oy dx dy
#> 2 E02002407 E02002336 -1.609934 53.79079 -1.624630 53.88605
#> 3 E02002336 E02002407 -1.624630 53.88605 -1.609934 53.79079
l2 = od_to_sf(od, od_data_centroids)
#> 0 origins with no match in zone ids
#> 0 destinations with no match in zone ids
#> points not in od data removed.
l2$v = 1
(l2_oneway = od_oneway(l2))
#> Simple feature collection with 1 feature and 7 fields
#> Attribute-geometry relationships: aggregate (5), NA's (2)
#> Geometry type: LINESTRING
#> Dimension: XY
#> Bounding box: xmin: -1.62463 ymin: 53.79079 xmax: -1.609934 ymax: 53.88605
#> Geodetic CRS: WGS 84
#> O D ox oy dx dy v
#> 1 E02002336 E02002407 -3.234564 107.6768 -3.234564 107.6768 2
#> geometry
#> 1 LINESTRING (-1.609934 53.79...
sf::st_length(l2)
#> Units: [m]
#> [1] 10635.99 10635.99
# With max_dist:
if (require(nngeo)) {
(l3 = points_to_odl(p, max_dist = 10000))
sf::st_length(l3)
}
#> Loading required package: nngeo
#> lon-lat points
#> Units: [m]
#> [1] 0 0
(od = points_to_od(p, interzone_only = TRUE))
#> O D ox oy dx dy
#> 2 E02002407 E02002336 -1.609934 53.79079 -1.624630 53.88605
#> 3 E02002336 E02002407 -1.624630 53.88605 -1.609934 53.79079
l2 = od_to_sf(od, od_data_centroids)
#> 0 origins with no match in zone ids
#> 0 destinations with no match in zone ids
#> points not in od data removed.
l2$v = 1
(l2_oneway = od_oneway(l2))
#> Simple feature collection with 1 feature and 7 fields
#> Attribute-geometry relationships: aggregate (5), NA's (2)
#> Geometry type: LINESTRING
#> Dimension: XY
#> Bounding box: xmin: -1.62463 ymin: 53.79079 xmax: -1.609934 ymax: 53.88605
#> Geodetic CRS: WGS 84
#> O D ox oy dx dy v
#> 1 E02002336 E02002407 -3.234564 107.6768 -3.234564 107.6768 2
#> geometry
#> 1 LINESTRING (-1.609934 53.79...
sf::st_length(l2)
#> Units: [m]
#> [1] 10635.99 10635.99
# With max_dist:
if (require(nngeo)) {
(l3 = points_to_odl(p, max_dist = 10000))
sf::st_length(l3)
}
#> Loading required package: nngeo
#> lon-lat points
#> Units: [m]
#> [1] 0 0