Convert OD data into geographic 'desire line' objects
od_to_sf(
  x,
  z,
  zd = NULL,
  odc = NULL,
  silent = FALSE,
  filter = TRUE,
  package = "sfheaders",
  crs = 4326
)

od_to_sfc(
  x,
  z,
  zd = NULL,
  silent = TRUE,
  package = "sfheaders",
  crs = 4326,
  filter = TRUE
)
Arguments
- x
A data frame in which the first two columns are codes representing points/zones of origin and destination
- z
Zones representing origins and destinations
- zd
Zones representing destinations
- odc
A matrix containing coordinates representing line start and end points
- silent
Hide messages?
FALSEby default.- filter
Remove rows with no matches in
z?TRUEby default- package
Which package to use to create the sf object?
sfheadersis the default.- crs
The coordinate reference system of the output, if not known in
z. 4326 by default.
Examples
x = od_data_df
z = od_data_zones
desire_lines = od_to_sf(x, z)
#> 0 origins with no match in zone ids
#> 0 destinations with no match in zone ids
#> points not in od data removed.
desire_lines[1:3]
#> Simple feature collection with 7 features and 3 fields
#> Geometry type: LINESTRING
#> Dimension: XY
#> Bounding box: xmin: -1.564756 ymin: 53.77475 xmax: -1.517695 ymax: 53.81763
#> Geodetic CRS: WGS 84
#> geo_code1 geo_code2 all geometry
#> 1 E02002384 E02006875 966 LINESTRING (-1.54473 53.809...
#> 2 E02002404 E02006875 1145 LINESTRING (-1.51871 53.792...
#> 3 E02006875 E02006875 1791 LINESTRING (-1.546024 53.79...
#> 4 E02006876 E02006875 1035 LINESTRING (-1.517695 53.77...
#> 5 E02006861 E02002392 453 LINESTRING (-1.564756 53.81...
#> 6 E02006875 E02002392 286 LINESTRING (-1.546024 53.79...
#> 7 E02002392 E02006875 753 LINESTRING (-1.561391 53.80...
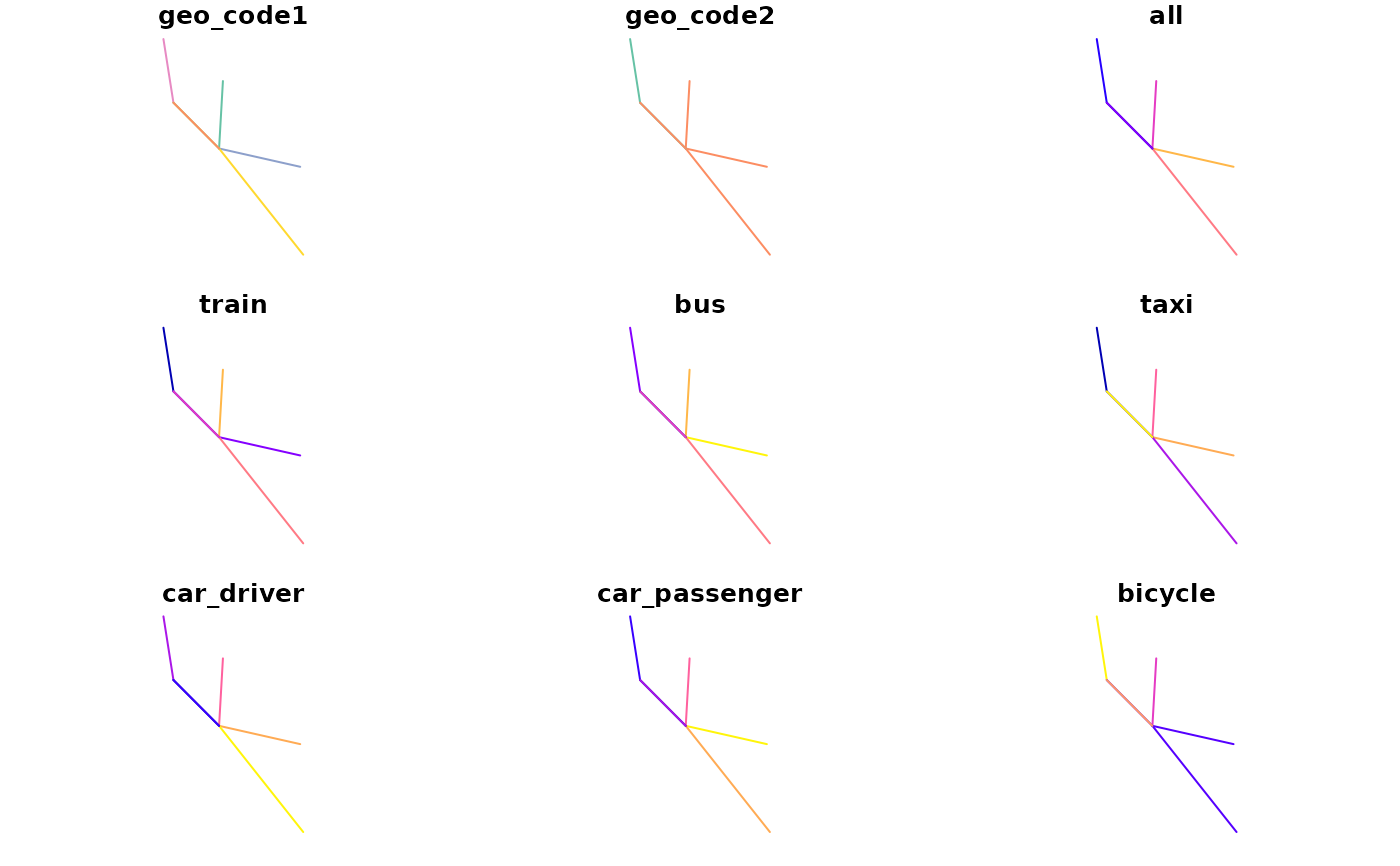
plot(desire_lines)
#> Warning: plotting the first 9 out of 10 attributes; use max.plot = 10 to plot all
 desire_lines_d = od_to_sf(od_data_df2, od_data_centroids2, od_data_destinations)
#> 0 origins with no match in zone ids
#> 0 destinations with no match in zone ids
#> points not in od data removed.
o1 = od_data_centroids2[od_data_centroids2[[1]] == od_data_df2[[1]][1], ]
d1 = od_data_destinations[od_data_destinations[[1]] == od_data_df2[[2]][1], ]
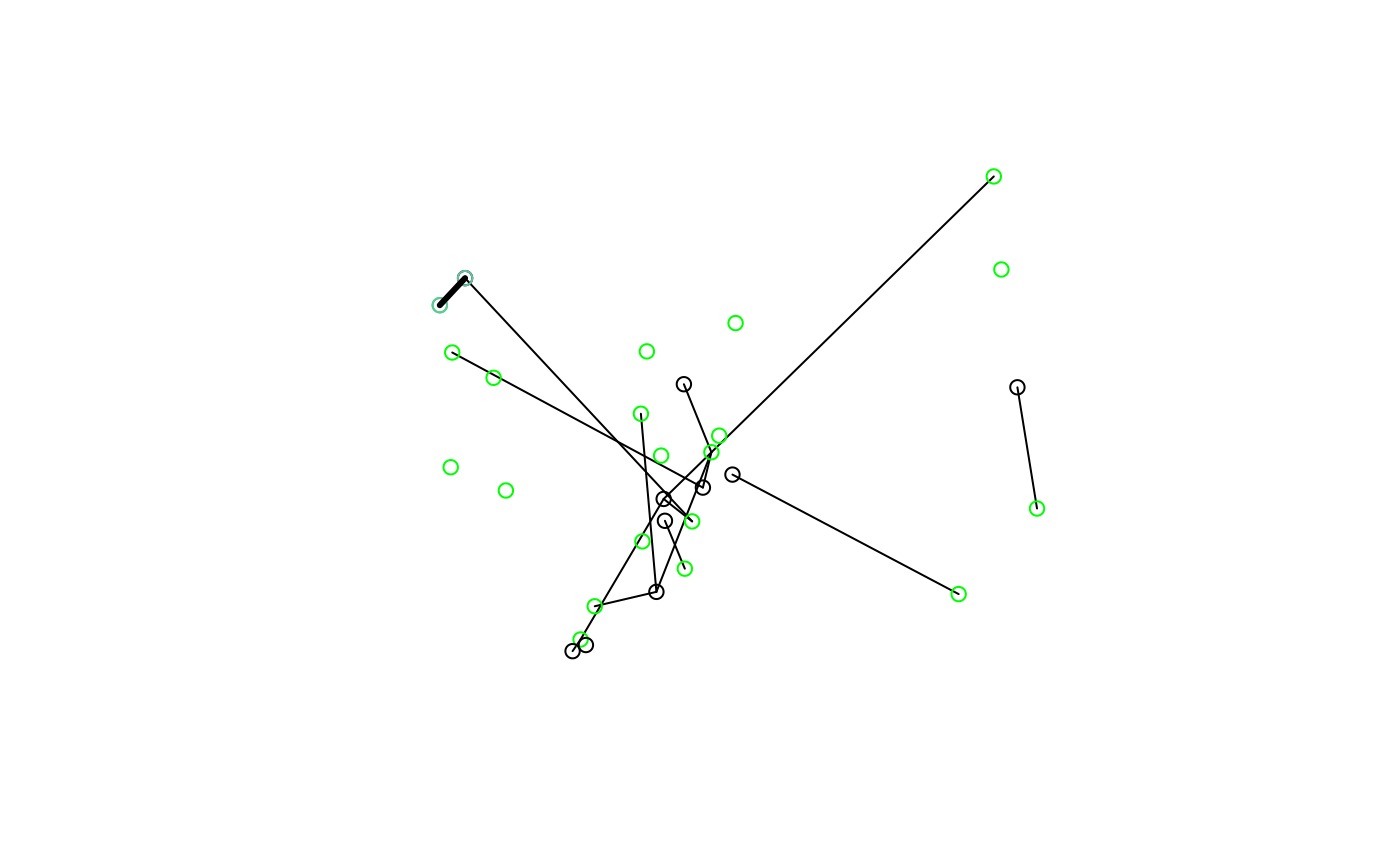
plot(desire_lines_d$geometry)
plot(od_data_centroids2$geometry, add = TRUE, col = "green")
plot(od_data_destinations$geometry, add = TRUE)
plot(o1, add = TRUE)
plot(d1, add = TRUE)
plot(desire_lines_d$geometry[1], lwd = 3, add = TRUE)
desire_lines_d = od_to_sf(od_data_df2, od_data_centroids2, od_data_destinations)
#> 0 origins with no match in zone ids
#> 0 destinations with no match in zone ids
#> points not in od data removed.
o1 = od_data_centroids2[od_data_centroids2[[1]] == od_data_df2[[1]][1], ]
d1 = od_data_destinations[od_data_destinations[[1]] == od_data_df2[[2]][1], ]
plot(desire_lines_d$geometry)
plot(od_data_centroids2$geometry, add = TRUE, col = "green")
plot(od_data_destinations$geometry, add = TRUE)
plot(o1, add = TRUE)
plot(d1, add = TRUE)
plot(desire_lines_d$geometry[1], lwd = 3, add = TRUE)
 n = 7
on = od_data_centroids2[od_data_centroids2[[1]] == od_data_df2[[1]][n], ]
dn = od_data_destinations[od_data_destinations[[1]] == od_data_df2[[2]][n], ]
plot(desire_lines_d$geometry)
plot(on, add = TRUE)
plot(dn, add = TRUE)
plot(desire_lines_d$geometry[n], lwd = 3, add = TRUE)
n = 7
on = od_data_centroids2[od_data_centroids2[[1]] == od_data_df2[[1]][n], ]
dn = od_data_destinations[od_data_destinations[[1]] == od_data_df2[[2]][n], ]
plot(desire_lines_d$geometry)
plot(on, add = TRUE)
plot(dn, add = TRUE)
plot(desire_lines_d$geometry[n], lwd = 3, add = TRUE)