Move desire line end points within zone to avoid all trips going to a single centroid
Source:R/jitter.R
od_jitter.RdThese functions tackle the problem associated with OD data representing movement to and from large zones. Typically the associated desire lines start and end in one point per zone. This function produces desire lines that can start and end anywhere (or at predefined points) within each zone. See issue #11 for details.
od_jitter(
  od,
  z,
  subpoints = NULL,
  code_append = "_ag",
  population_column = 3,
  max_per_od = 1e+05,
  keep_ids = TRUE,
  integer_outputs = FALSE,
  zd = NULL,
  subpoints_o = NULL,
  subpoints_d = NULL,
  disag = FALSE
)
Arguments
- od
An origin-destination data frame
- z
Zones representing origins and destinations
- subpoints
Points, lines or polygons within the zones. These define the OD data start/end points.
- code_append
The name of the column containing aggregate zone names
- population_column
The column containing the total population (if it exists)
- max_per_od
Maximum flow in the population_column to assign per OD pair. This only comes into effect if there are enough subpoints to choose from.
- keep_ids
Should the origin and destination ids be kept?
TRUEby default, meaning 2 extra columns are appended, with the nameso_aggandd_aggcontaining IDs from the original OD data.- integer_outputs
Should integer outputs be returned?
FALSEby default. Note: there is a known issue when integer results are generated. See https://github.com/ITSLeeds/od/issues/31 for details.- zd
Zones with ids matching the destination codes in input OD data
- subpoints_o
Points within origin zones representing possible destinations
- subpoints_d
Points within destination zones representing possible destinations
- disag
Should the od_disaggregate function be used as a 'back end' where possible? FALSE by default. See https://github.com/ITSLeeds/od/issues/39.
Value
An sf data frame
Examples
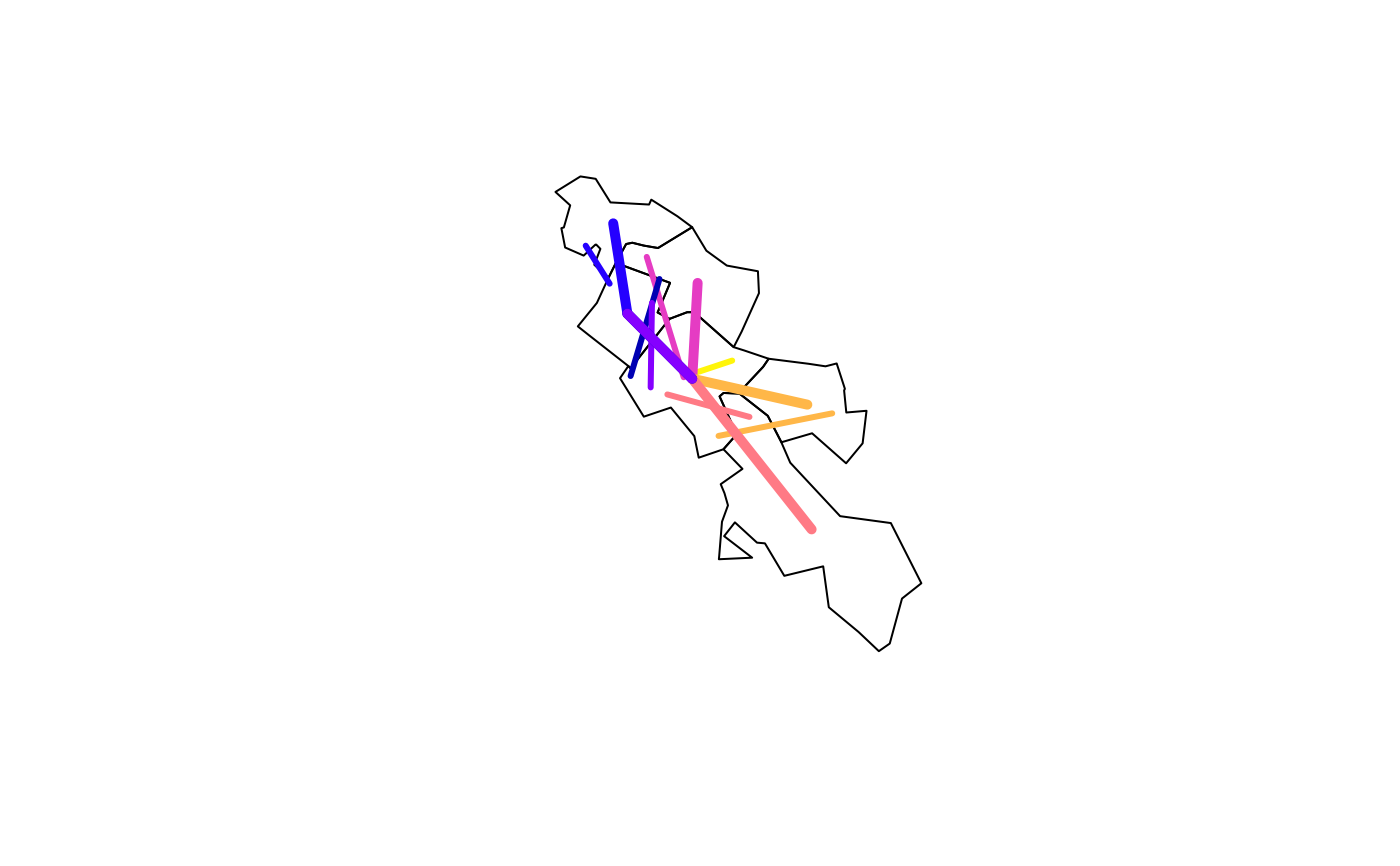
# Basic example
od = od_data_df
z = od_data_zones_min
dlr = od_jitter(od, z) # desire_lines_random
#> 0 origins with no match in zone ids
#> 0 destinations with no match in zone ids
#> points not in od data removed.
desire_lines = od_to_sf(od, z)
#> 0 origins with no match in zone ids
#> 0 destinations with no match in zone ids
#> points not in od data removed.
plot(z$geometry)
plot(dlr["all"], add = TRUE, lwd = 3)
dlr$all
#> [1] 966 1145 1791 1035 453 286 753
desire_lines$all
#> [1] 966 1145 1791 1035 453 286 753
plot(desire_lines["all"], add = TRUE, lwd = 5)
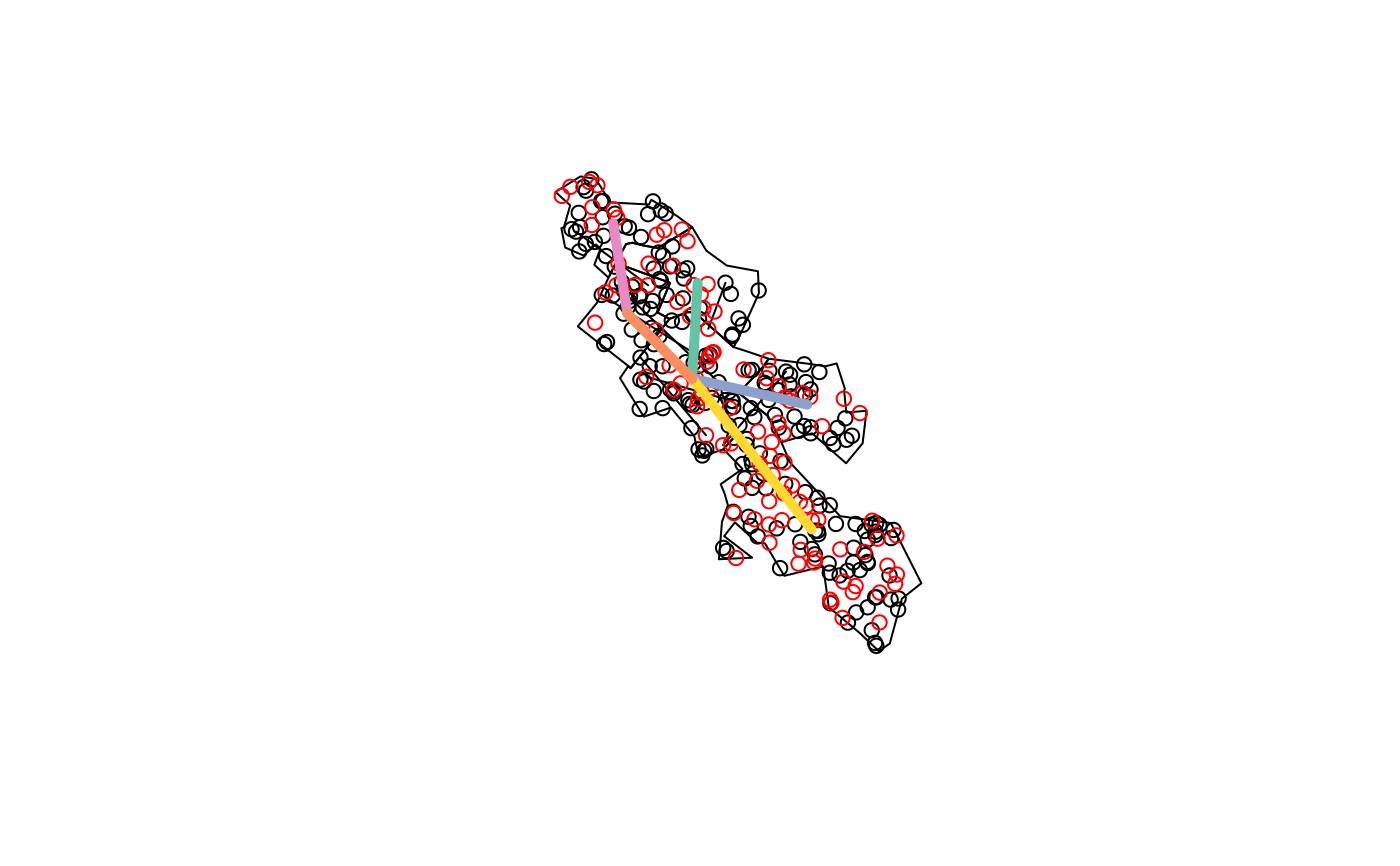
 # Example showing use of subpoints
subpoints_o = sf::st_sample(z, 200)
subpoints_d = sf::st_sample(z, 100)
dlr_d = od_jitter(od, z, subpoints_o = subpoints_o, subpoints_d = subpoints_d)
#> 0 origins with no match in zone ids
#> 0 destinations with no match in zone ids
#> points not in od data removed.
plot(z$geometry)
plot(dlr_d$geometry, add = TRUE)
plot(subpoints_o, add = TRUE)
plot(subpoints_d, col = "red", add = TRUE)
plot(desire_lines, add = TRUE, lwd = 5)
#> Warning: ignoring all but the first attribute
# Example showing use of subpoints
subpoints_o = sf::st_sample(z, 200)
subpoints_d = sf::st_sample(z, 100)
dlr_d = od_jitter(od, z, subpoints_o = subpoints_o, subpoints_d = subpoints_d)
#> 0 origins with no match in zone ids
#> 0 destinations with no match in zone ids
#> points not in od data removed.
plot(z$geometry)
plot(dlr_d$geometry, add = TRUE)
plot(subpoints_o, add = TRUE)
plot(subpoints_d, col = "red", add = TRUE)
plot(desire_lines, add = TRUE, lwd = 5)
#> Warning: ignoring all but the first attribute
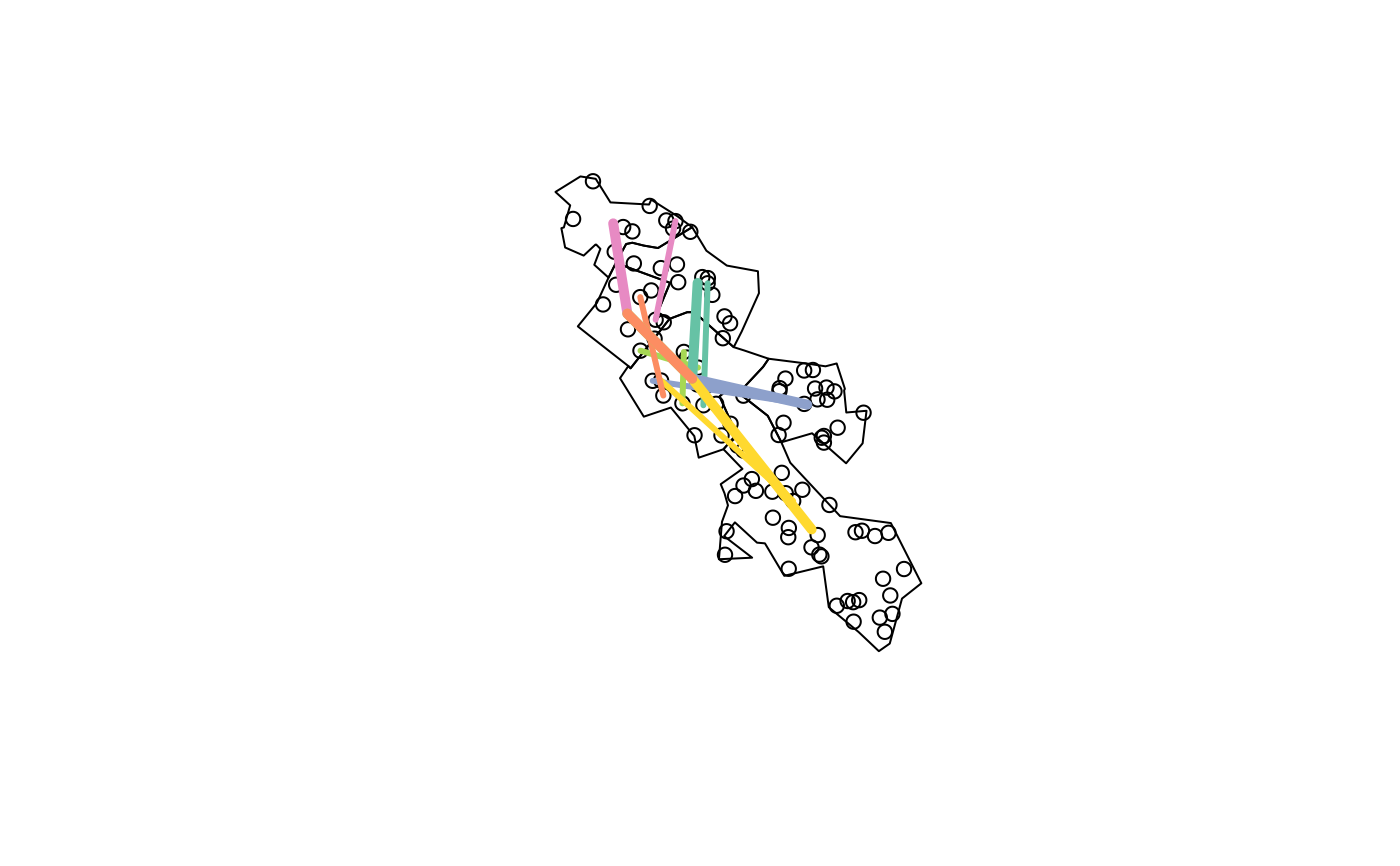
 # mapview::mapview(desire_lines) + dlr + z # interactive map
sp = sf::st_sample(z, 100)
dlr2 = od_jitter(desire_lines, z, subpoints_o = sp, subpoints_d = sp)
plot(z$geometry)
plot(sp, add = TRUE)
plot(dlr2, add = TRUE, lwd = 3)
#> Warning: ignoring all but the first attribute
plot(desire_lines, add = TRUE, lwd = 5)
#> Warning: ignoring all but the first attribute
# mapview::mapview(desire_lines) + dlr + z # interactive map
sp = sf::st_sample(z, 100)
dlr2 = od_jitter(desire_lines, z, subpoints_o = sp, subpoints_d = sp)
plot(z$geometry)
plot(sp, add = TRUE)
plot(dlr2, add = TRUE, lwd = 3)
#> Warning: ignoring all but the first attribute
plot(desire_lines, add = TRUE, lwd = 5)
#> Warning: ignoring all but the first attribute
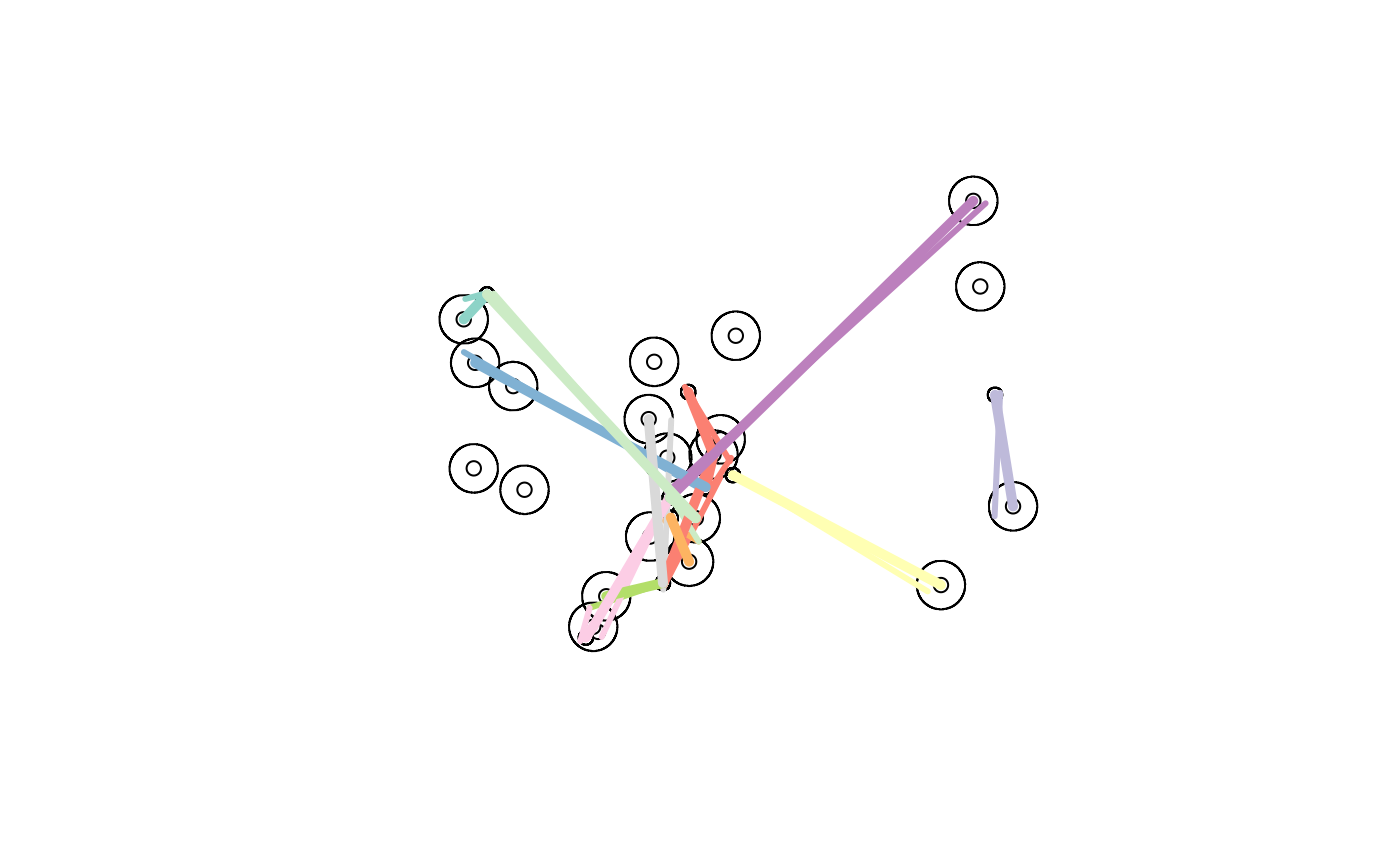
 # Example showing jittering with origin and destination zones
od = od_data_df2
z = sf::st_buffer(od_data_centroids2, dist = 1000)
zd = sf::st_buffer(od_data_destinations, dist = 300)
zd = zd[zd[[1]] %in% od[[2]], ]
desire_lines = od_to_sf(od, od_data_centroids2, zd = od_data_destinations)
#> 0 origins with no match in zone ids
#> 0 destinations with no match in zone ids
#> points not in od data removed.
dlr = od_jitter(od, z, zd = zd)
#> 0 origins with no match in zone ids
#> 0 destinations with no match in zone ids
#> points not in od data removed.
plot(z$geometry)
plot(od_data_centroids2$geometry, add = TRUE)
plot(od_data_destinations$geometry, add = TRUE)
plot(zd$geometry, add = TRUE)
plot(dlr, add = TRUE, lwd = 3)
#> Warning: ignoring all but the first attribute
plot(desire_lines, add = TRUE, lwd = 5)
#> Warning: ignoring all but the first attribute
# Example showing jittering with origin and destination zones
od = od_data_df2
z = sf::st_buffer(od_data_centroids2, dist = 1000)
zd = sf::st_buffer(od_data_destinations, dist = 300)
zd = zd[zd[[1]] %in% od[[2]], ]
desire_lines = od_to_sf(od, od_data_centroids2, zd = od_data_destinations)
#> 0 origins with no match in zone ids
#> 0 destinations with no match in zone ids
#> points not in od data removed.
dlr = od_jitter(od, z, zd = zd)
#> 0 origins with no match in zone ids
#> 0 destinations with no match in zone ids
#> points not in od data removed.
plot(z$geometry)
plot(od_data_centroids2$geometry, add = TRUE)
plot(od_data_destinations$geometry, add = TRUE)
plot(zd$geometry, add = TRUE)
plot(dlr, add = TRUE, lwd = 3)
#> Warning: ignoring all but the first attribute
plot(desire_lines, add = TRUE, lwd = 5)
#> Warning: ignoring all but the first attribute
 # Larger example with only subset of matching zones
# od = od_data_df_medium
# od_sf = od_to_sf(od, od_data_zones)
# dlr3 = od_jitter(od_sf, od_data_zones)
# plot(od_sf[od$all > 200, 1])
# plot(dlr3[od$all > 200, 1])
# mapview::mapview(od_sf$geometry[od$all > 200])
# Larger example with only subset of matching zones
# od = od_data_df_medium
# od_sf = od_to_sf(od, od_data_zones)
# dlr3 = od_jitter(od_sf, od_data_zones)
# plot(od_sf[od$all > 200, 1])
# plot(dlr3[od$all > 200, 1])
# mapview::mapview(od_sf$geometry[od$all > 200])