Reproducible Data Science for Road Safety Research
2025-09-02
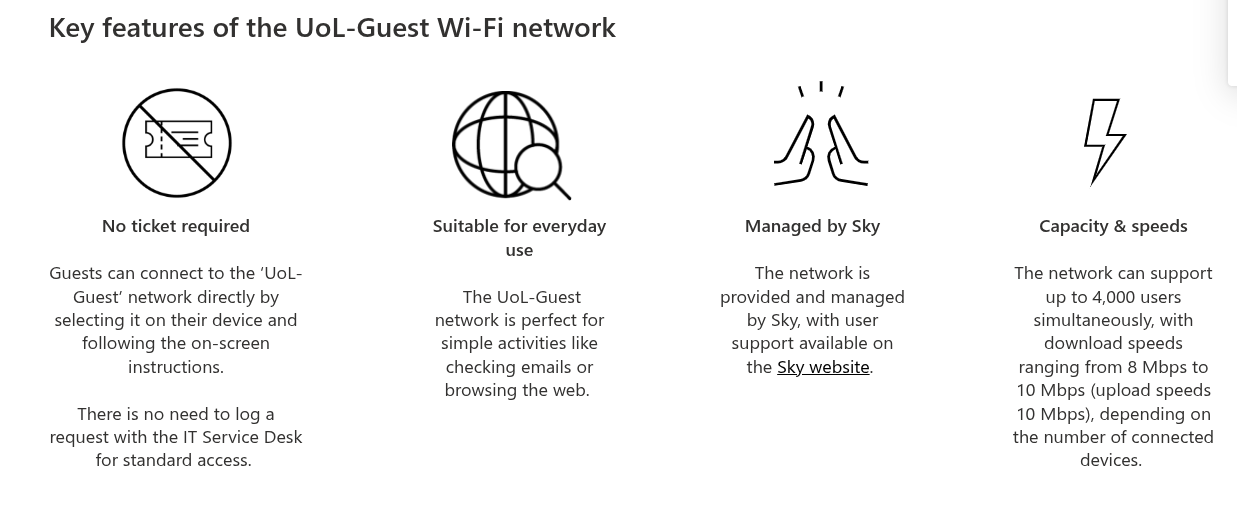
WiFi
Why are we doing this?

Task 3: Spatial visualisation (30 min)
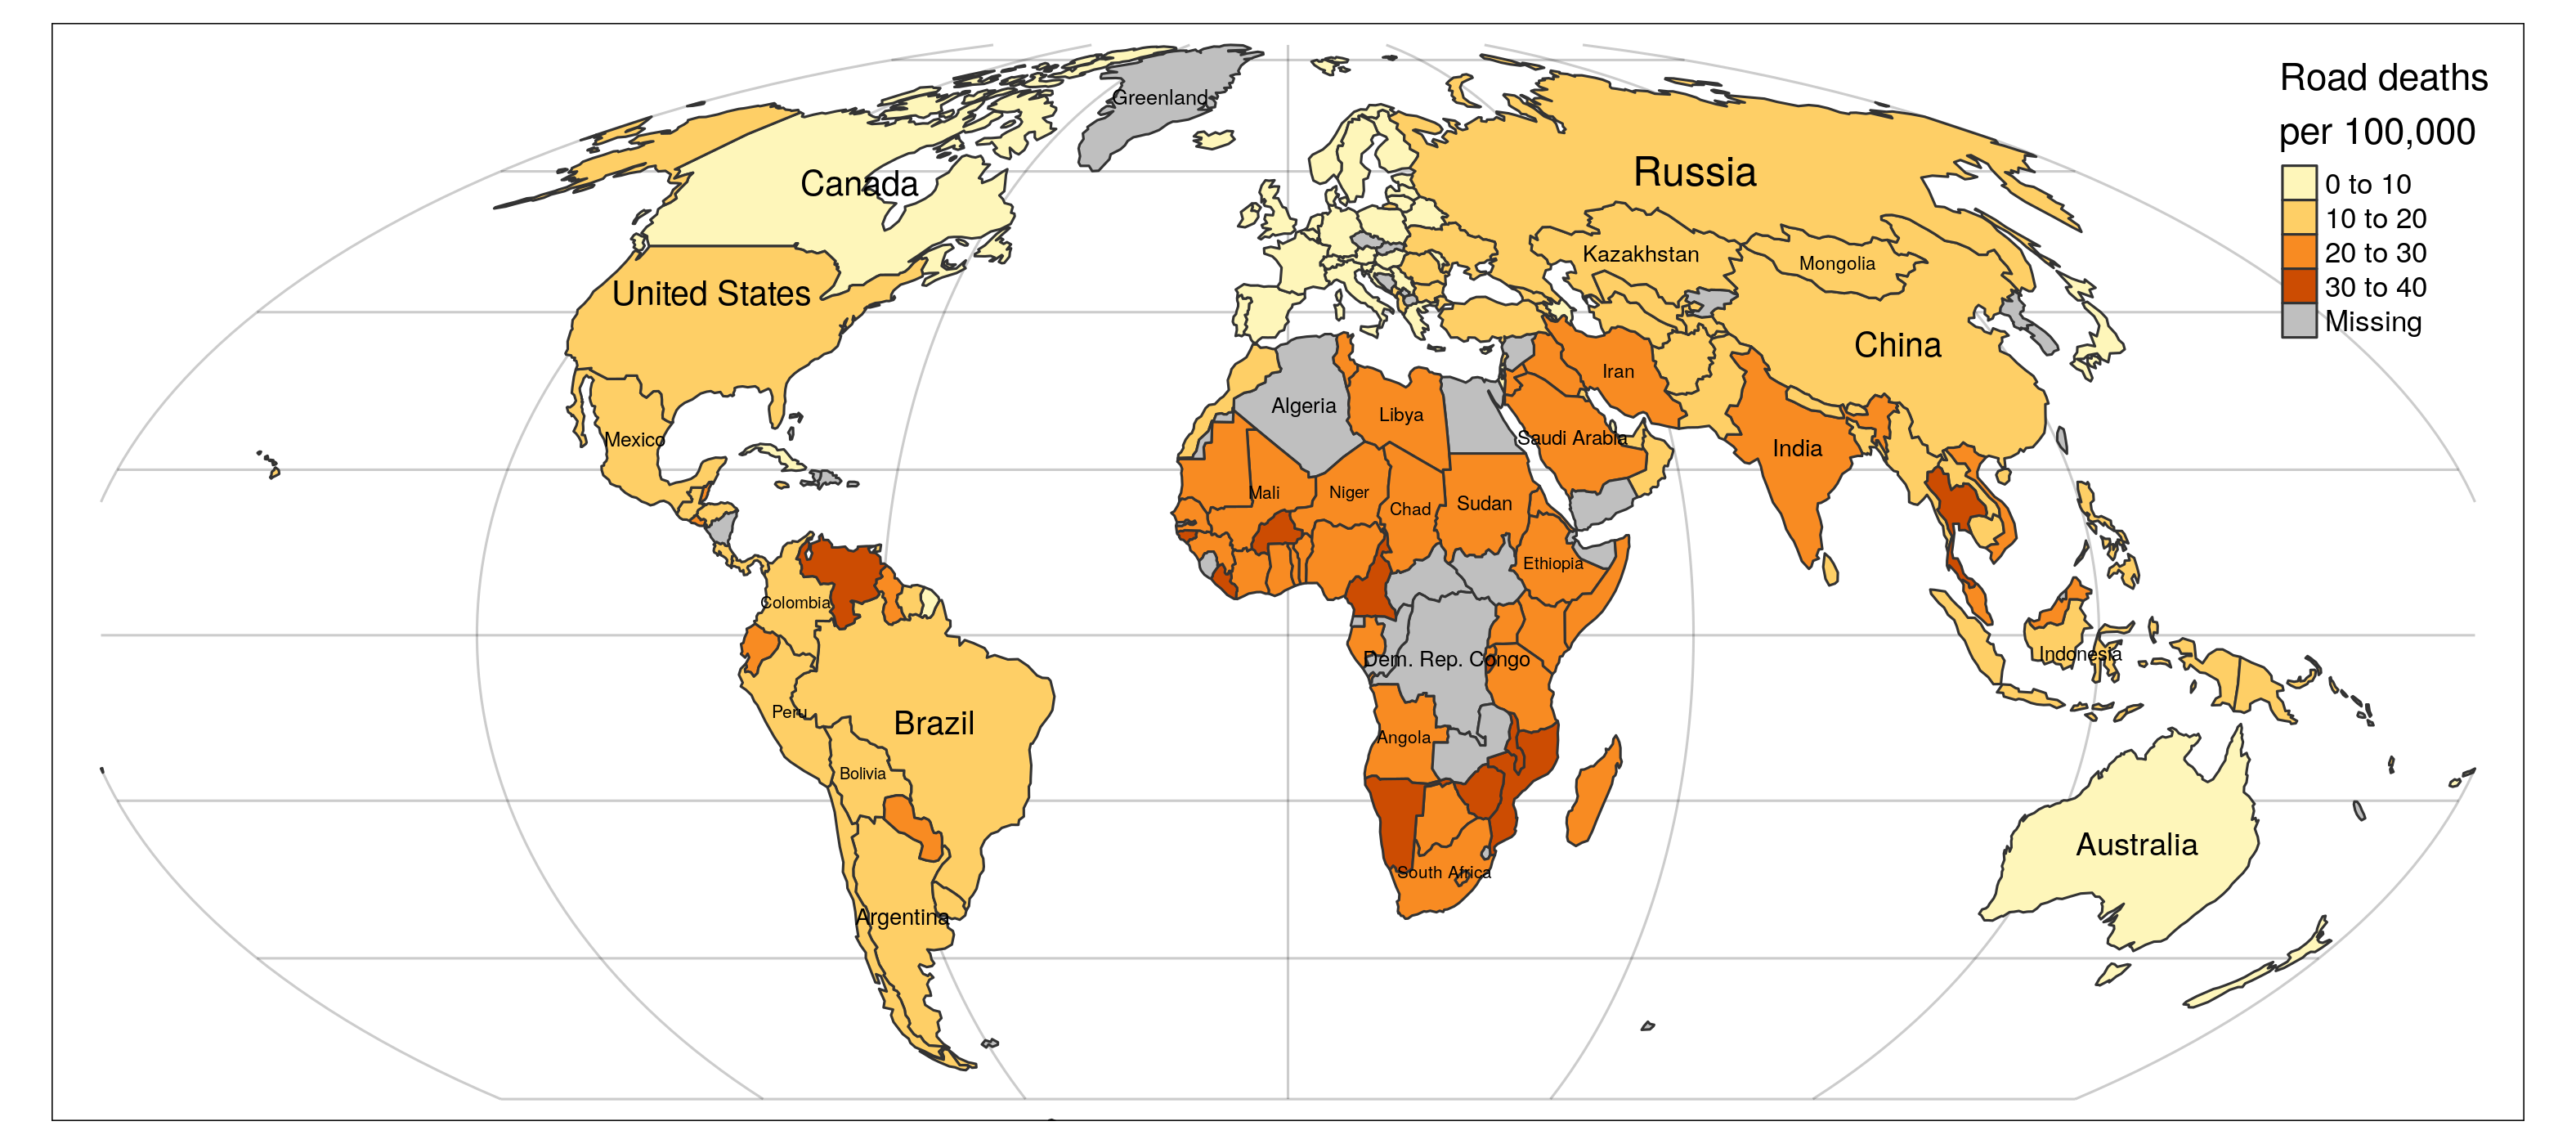
- Convert collision data to spatial format and plot on a map.
- Aggregate collisions by area (e.g., by local authority).
- Create maps to visualise spatial patterns.
See Chapter 7 on spatial data.
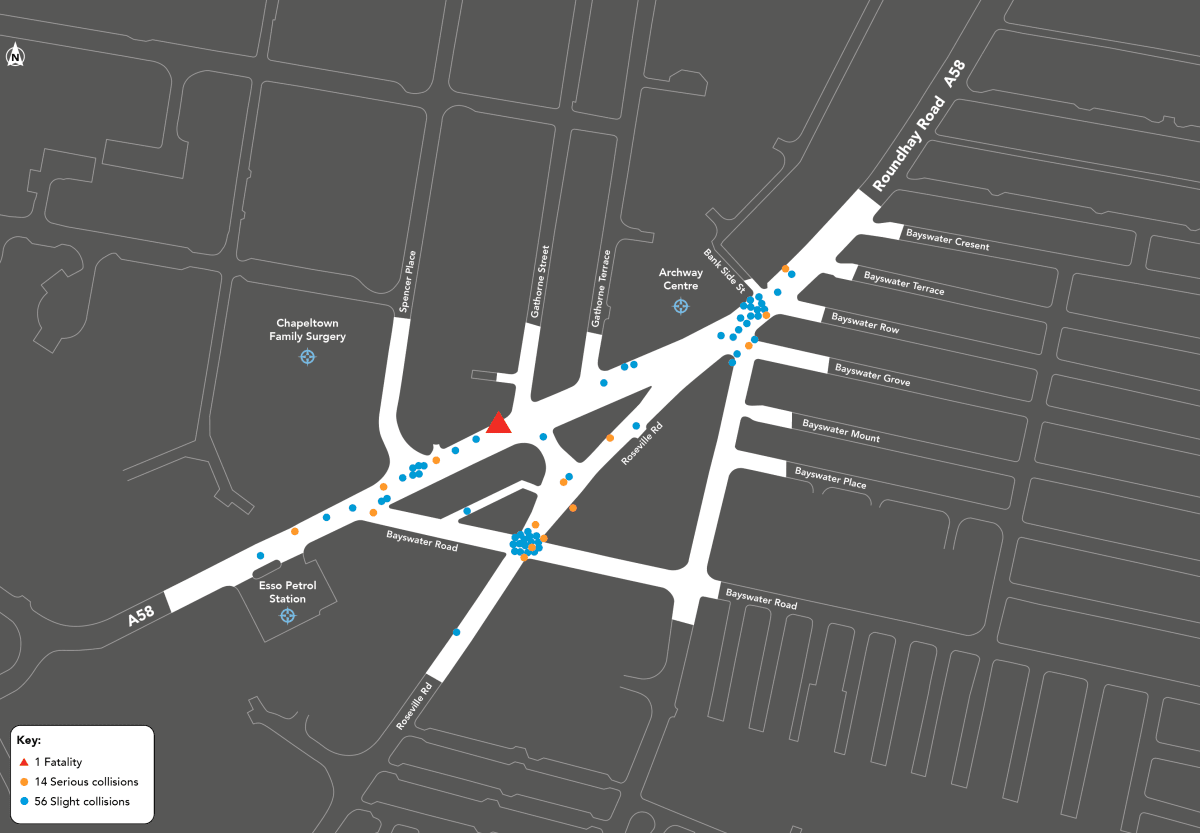
Output you’ll be making in Leeds-focussed bonus task

Source: Google Gemini
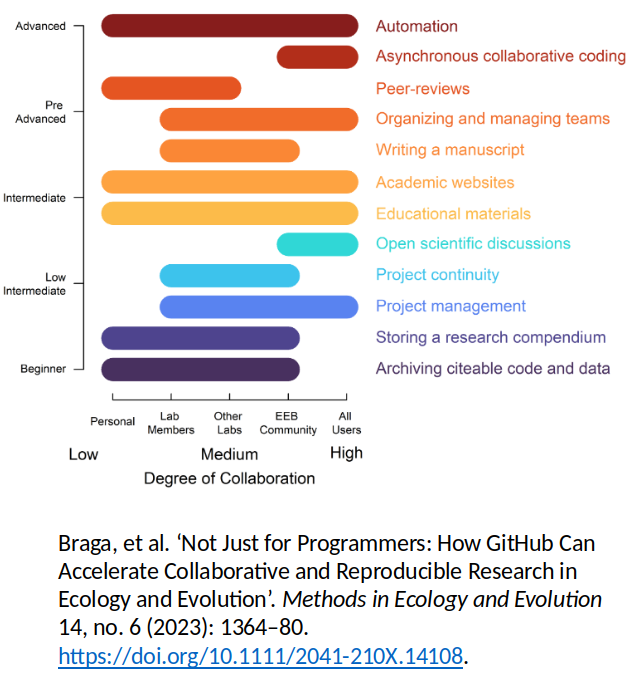
Stages of open and reproducible science
Open access to the publications
Open access to sample (synthetic if sensitive) data
Open access to the code
Fully reproducible paper published with documentation
Project deployed in tool for non-specialist use
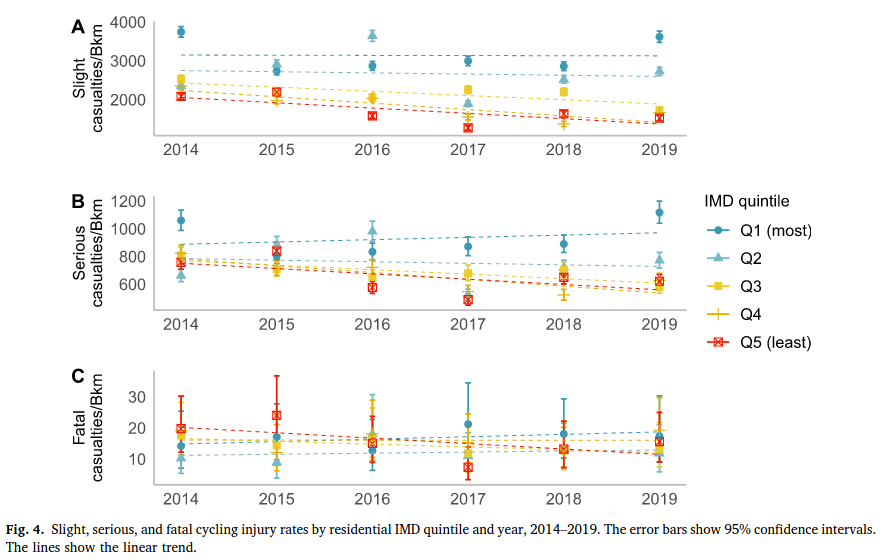
Example 1: Increasing inequalities in cycling casualties
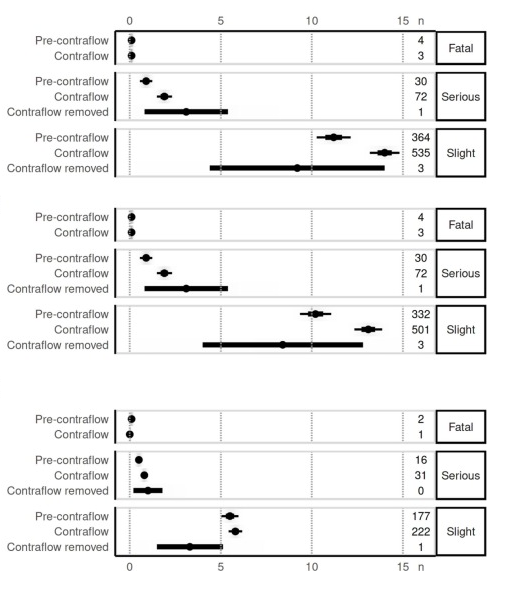
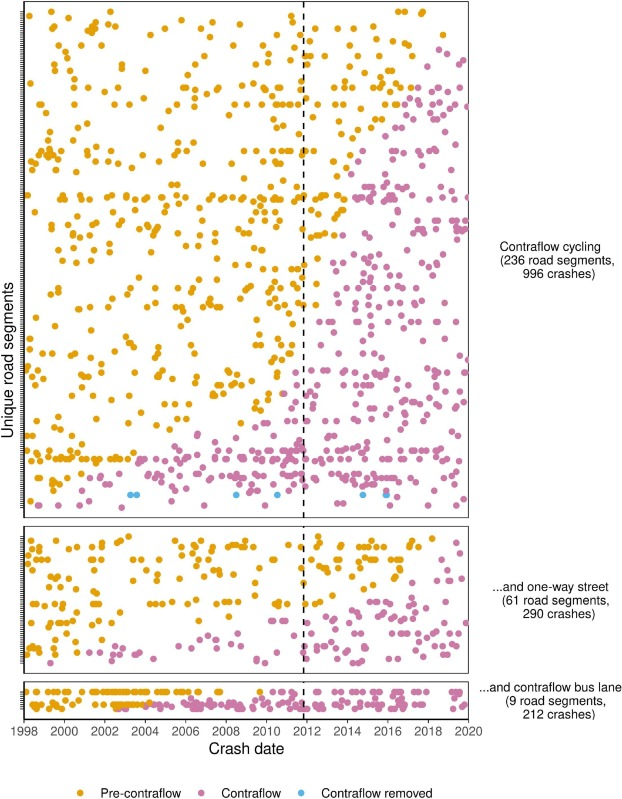
Example 2: Contraflow safety (Tait et al. 2023)